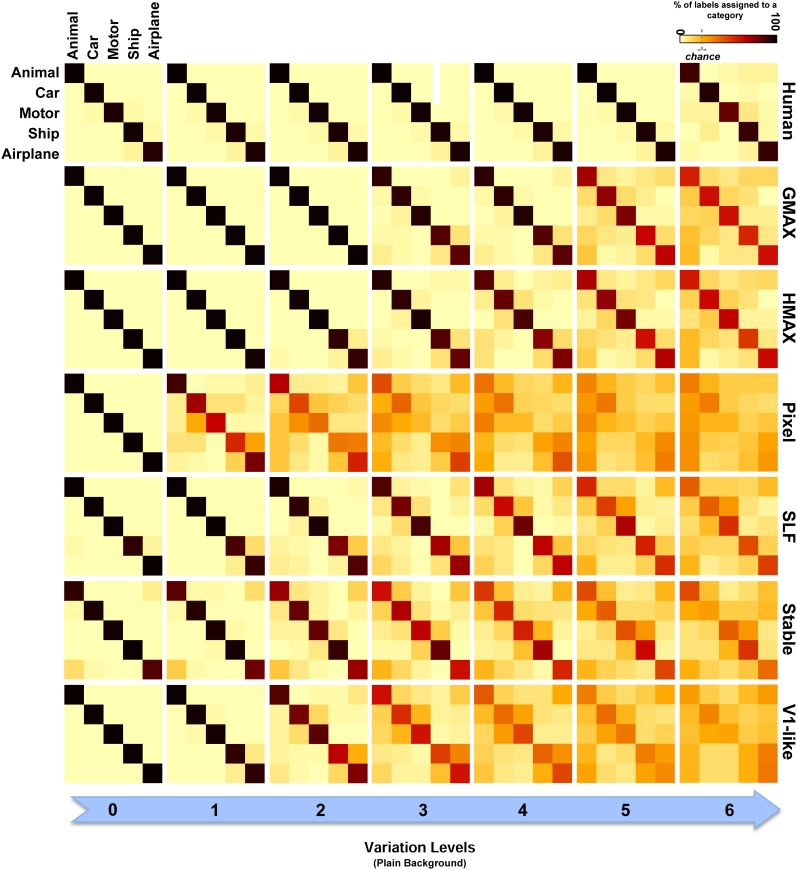
Figure 7.
Confusion matrices for the multiclass invariant object categorization task with plain background. Each color-coded matrix shows the performance of a model in categorizing different object categories, as specified in the first matrix at the top-left corner. Matrices in each column show confusion matrices for a particular level of variation (from 0 to 6) and each row shows confusion matrices for one model (model name is written at the right end of each row). The first row illustrates the performance of humans in psychophysical experiments. The color bar at the top-right color codes the percentage of the subject responses (labels) assigned to each category. The chance level is specified with a dashed line on the color bar.

