Fig. 3.
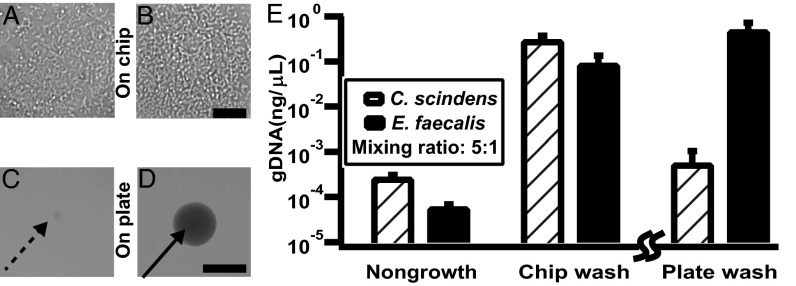
Validation of the chip wash method with a model community of C. scindens and E. faecalis. Samples were collected on day 1. (A and B) Representative optical microscopy of C. scindens (A) and E. faecalis (B) grown on SlipChip. (C and D) Representative photographs of C. scindens (C) and E. faecalis (D) grown on an agar plate. (E) Graph showing genomic DNA of C. scindens and E. faecalis recovered from nongrowth negative control, chip wash, and plate wash solutions. The nongrowth control and the chip wash experiments were performed using an identical procedure and can be directly compared. Because the plate wash experiment requires a different protocol, only the relative values can be compared (emphasized by the break in the axis). Error bars indicate SD (n = 3). Scale bar, 30 μm for A and B and 1 mm for C and D.

