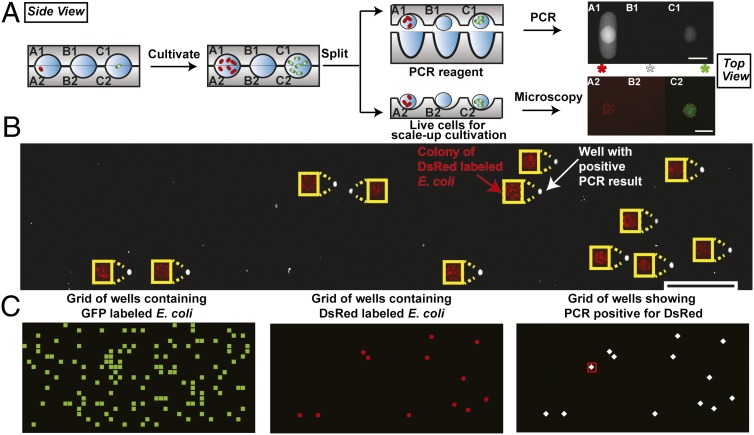
Fig. 4.
Cultivating pure microcolonies from a mixture and using PCR to identify specific microcolonies. Schematics show side views, whereas photographs show top views. (A) Schematic illustrating the cultivation of single cells from a mixture of E. coli expressing GFP and DsRed genes, as well as a method for splitting individual colonies. PCR was used to identify the E. coli expressing DsRed gene on one half of the split chip. The PCR reagents wells have an ellipsoidal cross-section from top view. An increase in fluorescence intensity indicated a positive result for PCR, and thus, the presence of the DsRed gene. Fluorescence microscopy identified wells that contained microbes expressing red and green fluorescent proteins, matching corresponding results in PCR. (B) To test the accuracy of the PCR assay, results from microscopy imaging (red), indicating E. coli colonies expressing DsRed gene, and PCR assay (white) were montaged with an offset to allow visualization without overlap. (C) Plot of a 20 × 50-well grid was used to represent the position of each well on the same device. Elements corresponding to wells were colored to highlight the presence of E. coli GFP colonies (green squares), E. coli DsRed colonies (red dots), and PCR positive results for DsRed (white diamonds). A red square in the third plot denotes a false positive result from PCR. The different shapes of markers used in C do not represent the shapes of wells. Scale bar, 200 µm for A, 2 mm for B. A 200-µm-wide yellow rectangle was used as scale bar for images showing DsRed expressing E. coli colonies in B. Note: schematics are not to scale; dimensions are provided in SI Appendix.

