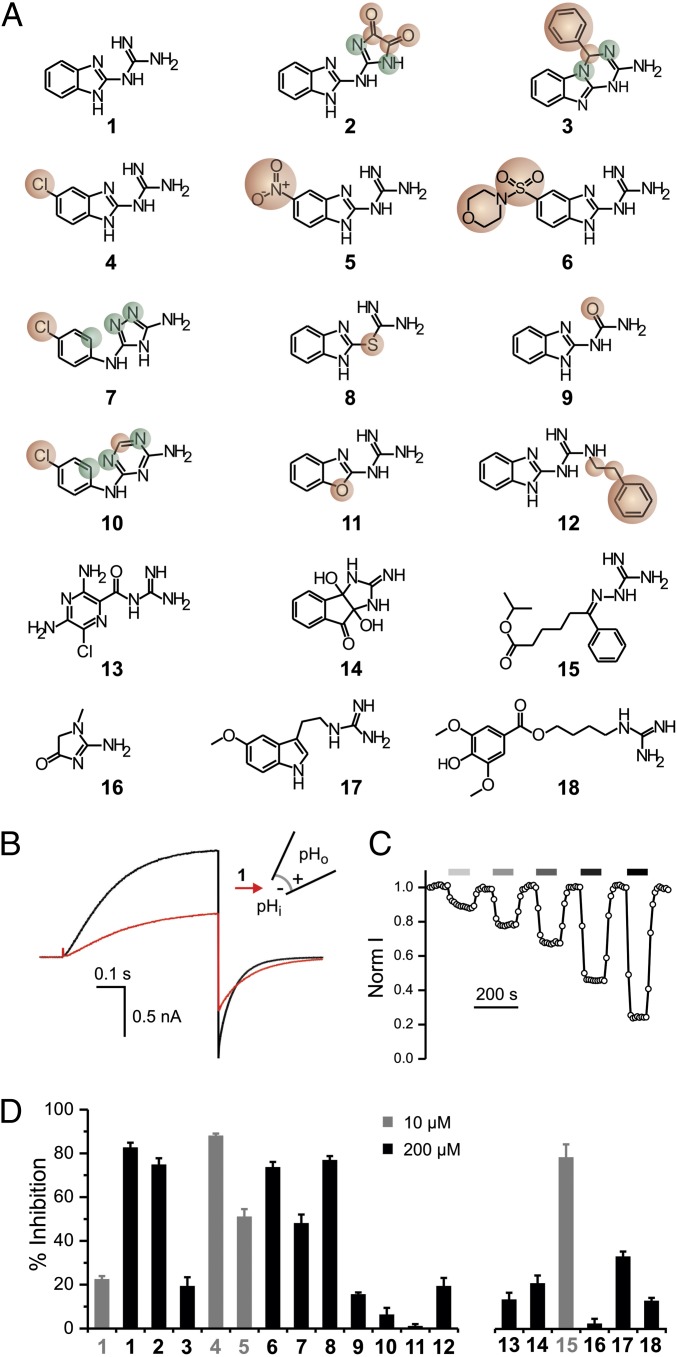
Fig. 1.
Exploring Hv1 inhibition by guanidine derivatives. (A) Tested compounds: (1) 2GBI, (2) 2-(2-benzimidazolylamino)-imidazole-4,5-dione, (3) 4-phenyl-1,4-dihydro[1,3,5]triazino[1,2-a]benzimidazol-2-amine, (4) 5-chloro-2-guanidinobenzimidazole, (5) 5-nitro-2-guanidinobenzimidazole, (6) 1-[5-(morpholin-4-ylsulfonyl)-1H-benzimidazol-2-yl]guanidine, (7) N-(4-chlorophenyl)-4H-1,2,4-triazole-3,5-diamine, (8) S-1H-benzimidazol-2-yl-carbamothioate, (9) 1-(benzimidazol-2-yl)urea, (10) N-(4-chlorophenyl)-1,3,5-triazine-2,4-diamine, (11) 2-guanidino-benzoxazole, (12) 1-(benzimidazol-2-yl)-3-(2-phenylethyl)guanidine, (13) amiloride, (14) 3a,8a-dihydroxy-2-imino-2,3,3a,8a-tetrahydroindeno[1,2-d]imidazol-8(1H)-one, (15) isoproyl 6-(guanidinoimino)-6-phenylhexanoate, (16) creatinine, (17) 1-[2-(5-methoxy-1H-indol-3-yl)ethyl] guanidine, and (18) leonurine. Compounds 2–12 are structurally related to compound 1. Atoms or substituents differing from compound 1 are highlighted in red. Different connectivity from compound 1 is highlighted in green. (B) Proton currents measured in an inside-out patch from a Xenopus oocyte expressing human Hv1 WT in response to a depolarization to +120 mV from a holding potential of −80 mV. The black trace was recorded in the absence of inhibitor, and the red trace was recorded after the addition of 50 μM compound 1 (2GBI) in the bath solution. pHi = pHo = 6.0. (C) Example of a time course of inhibition of Hv1 channels exposed to increasing concentrations of 2GBI. Current was normalized to the value measured under bath perfusion in the absence of inhibitor. Horizontal bars of increasingly darker gray color indicate the presence of 5, 10, 20, 50, and 100 μM inhibitor in the bath. (D) Inhibition of Hv1 proton currents by the indicated compounds at 10 μM (gray) or 200 μM (black) concentration. Data are means ± SEMs (n ≥ 3). Currents were measured as in B.

