Fig. 5.
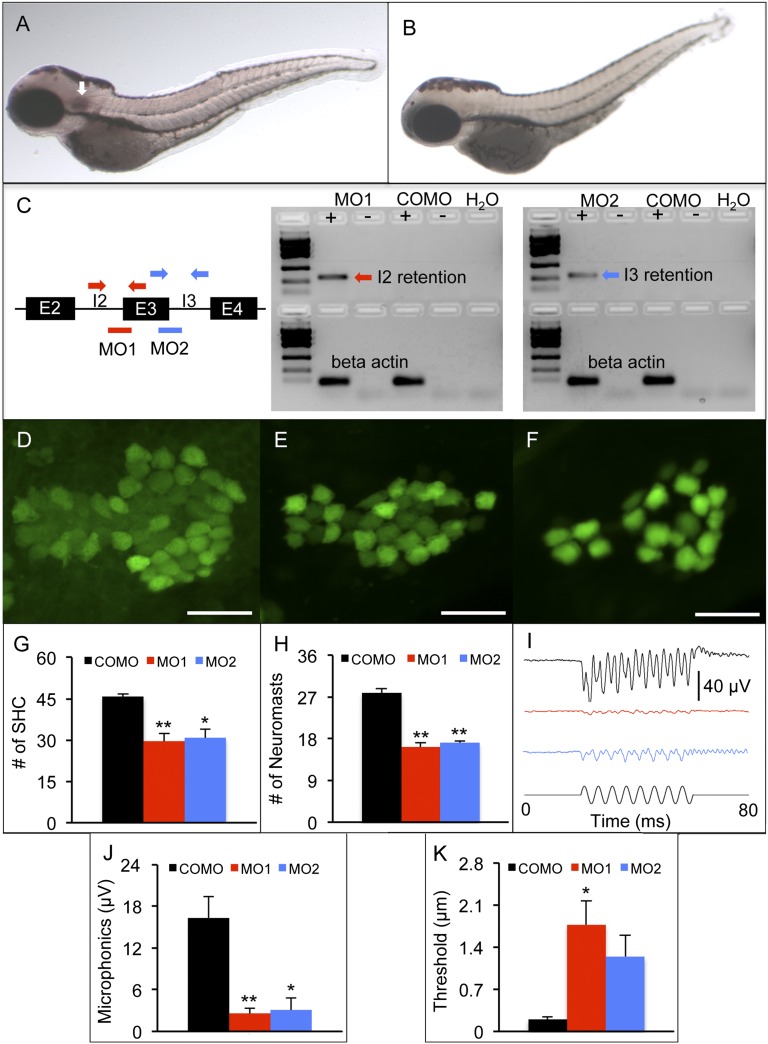
Zebrafish model of fam65b sensorineural hearing loss. (A and B) In situ hybridization whole mounts of 3 days postfertilization (dpf), wild-type AB zebrafish with fam65b antisense probe (A) and sense probe (B). The arrow in A indicates fam65b expression in the otic vesicle. (C) (Left) A schematic drawing of morpholinos (red and blue lines) and primer binding sites (red and blue arrows) used for detection of intron 2 and 3 retention, respectively. (Center and Right) RT-PCR signals indicating intron retention in MO1 and MO2 morphants but not in control morphants (COMOs). (D–F) Confocal images of saccular hair cells (green) of a control morphant (D) and MO1 (E) and MO2 (F) morphants. (Scale bars, 20 μm.) (G) Comparison of numbers of saccular hair cells (SHC) among controls (n = 9) and MO1 (n = 7) and MO2 (n = 7) morphants. (H) Comparison of numbers of neuromasts per side among controls (n = 10) and MO1 (n = 8) and MO2 (n = 17) morphants. (I) Microphonic potential waveforms of control (Upper trace) and MO1 and MO2 morphants (two Middle traces) in response to 200-Hz sinusoidal stimuli (Lower trace) at 5.8-μm displacement. (J) Comparison of microphonic amplitude (root mean square) among controls (n = 7) and MO1 (n = 7) and MO2 (n = 8) morphants. Stimuli: 200 Hz at 5.8-μm displacement. (K) Comparison of microphonic thresholds among controls (n = 7) and MO1 (n = 7) and MO2 (n = 8) morphants. ANOVAs followed by Tukey posttests were performed to determine the significance of differences. Data are represented as means ± SEM. **P < 0.001, *P < 0.005.

