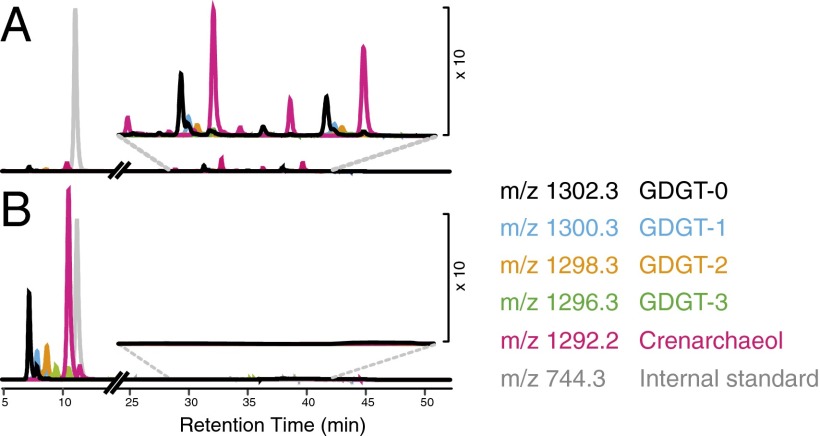
Fig. 3.
HPLC-APCI-MS composite extracted ion chromatograms (EIC) of total lipid extract (TLE) from 131 m, 0.3–3 µm size fraction sample before (A) and after (B) acid hydrolysis. Colored traces are EICs of m/z values of individual core GDGTs and the hydrolysis-resistant internal standard. Late eluting peaks in A represent three putative series of core GDGTs released from IPL GDGTs by fragmentation in the APCI source. After acid hydrolysis, late-eluting peaks disappeared and the peak area of core GDGTs increased, supporting this interpretation.

