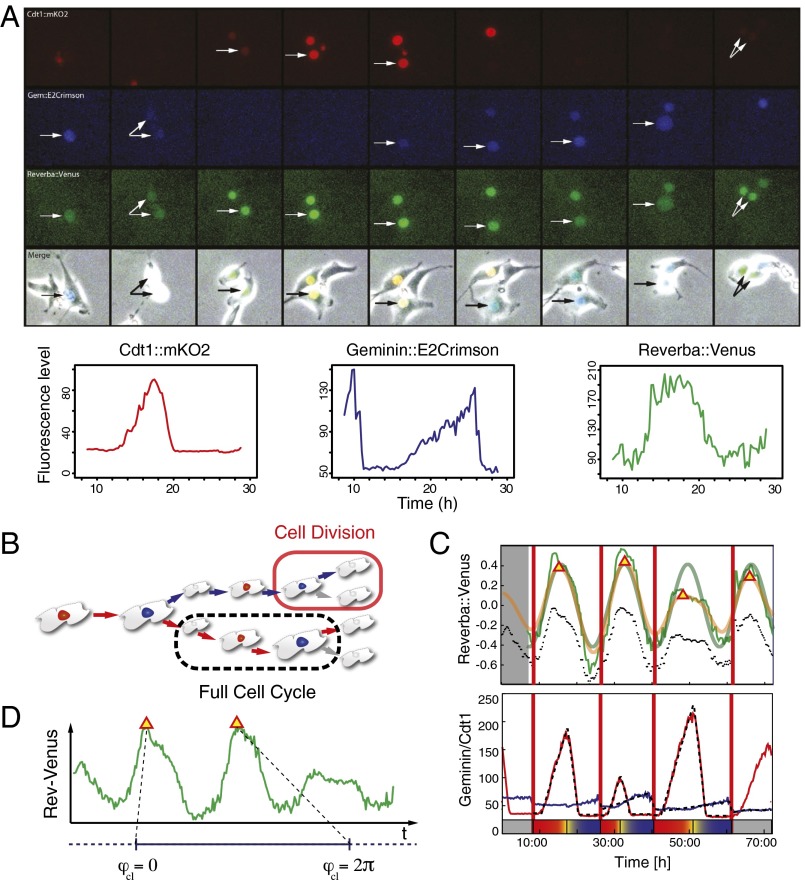
Fig. 1.
Image acquisition, cell tracking, and resulting time series of NIH3T3_ Rev-Erbα::Venus_FUCCI-2A cells (see SI Appendix for details). (A) Time series of a representative single cycle for the various fluorescent reporters and respective traces in NIH3T3_Rev-Erbα::Venus_FUCCI-2A cells (unsynchronized in 15% FBS). From top to bottom: G1 (red), Cdt1::mKO2; S/G2/M (blue), Gem::E2Crimson; Clock (green), Rev-Erbα::Venus; and Merge, fluorescent channels combined with the corresponding brightfield image. Arrows point to tracked cell nuclei. Images are 2.5 h apart. Traces at the bottom have been plotted from measured intensities extracted from tracking with the LineageTracker plugin for ImageJ. (B) Schematic of a lineage tree showing a cell division and a full cell-cycle interval. Trees are obtained using the Lineage Tracker software. (C) Computational analysis of the markers (72 h). (Upper) A detrended and a smoothed version of the Rev-Erbα::Venus clock marker traces (unprocessed data shown as dotted lines) appear in green and yellow, respectively. Segments at the beginning and end have been removed. We obtain an estimate for the clock period using spectrum resampling (thick green). Red triangles mark estimated clock peaks. (Lower) Red and blue lines represent G1 and S/G2/M cell cycle markers, respectively. We fit a piecewise linear model to both markers (shown as dashed line) and extract the time of the G1–S transition (shown on the bottom). Thick vertical lines correspond to division times as marked during tracking. (D) The clock phase between two clock marker peaks is defined as the relative position between the peaks, normalized to the interval (0, 2π).

