Fig. 2.
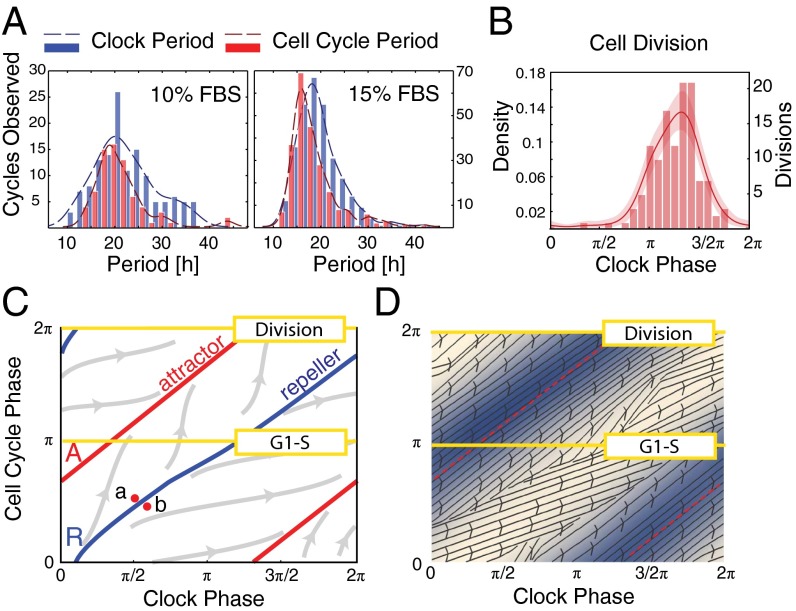
Phase dynamics for unsynchronized cells. (A) Histograms showing distributions of periods for both the clock (blue) and cell cycle (red). Unsynchronized cells grown in 10% FBS (mean clock period, 21.9 ± 1.1 h; mean cell-cycle period, 21.3 ± 1.3 h) and 15% FBS (mean clock period, 19.4 ± 0.5 h; mean cell-cycle period, 18.6 ± 0.6 h). (B) Phase histograms for cells in 15% FBS; mean phase of division is 3.97 ± 0.14 radians. (C) Illustration of possible trajectories in 1:1 phase-locked system, showing the situation for simulated noise-free deterministic dynamics. All trajectories apart from those starting on the repeller R converge to the attracting periodic orbit A, which is a circle winding around the torus in a 1:1 fashion. Cells starting at the close points a and b will divide approximately half a clock period apart. This is what gives rise to the phase-skipping instability described in the text. Such a change in state and the consequent change in division timing can be caused by stochasticity. (D) Estimated phase diagram from experimental data for cells in 15% FBS (SI Appendix, section 2.5). The red dashed curve shows the mean trajectory and the blue levels show the density of cells passing through a region. The arrows show the mean direction that the cells flow in near that point on the torus.

