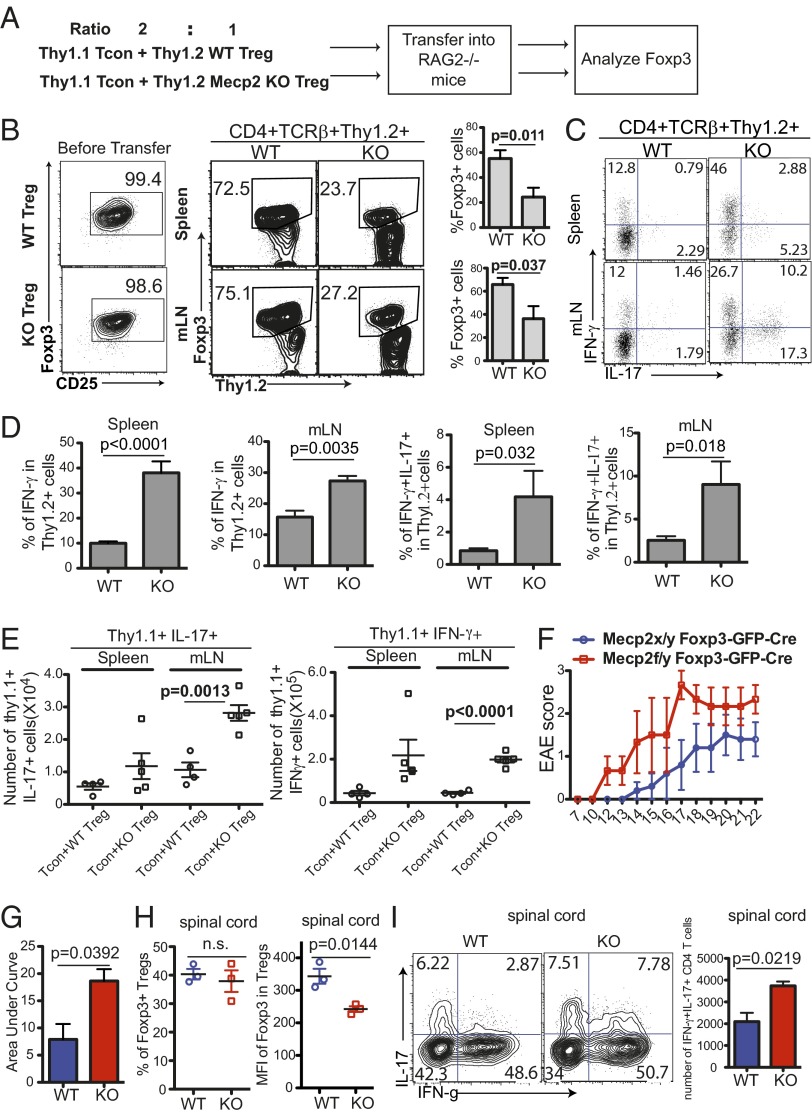
Fig. 5.
MeCP2 is required for the maintenance of Foxp3 expression in Tregs in vivo. (A–E) The 2.0 × 10⁵ CD4+CD25− T cells from Thy1.1+ WT B6 mice were sorted and mixed with 1.0 × 10⁵ Thy1.2+ CD4+CD25+ GFP+ Tregs from Mecp2f/y Foxp3–GFP–Cre (KO) or Mecp2x/y Foxp3–GFP–Cre (WT) littermate control mice, and the mixture was cotransferred into RAG2−/− mice. Recipient mice were euthanized 3 wk after transfer for flow cytometry analysis. Bar graphs in B and D show means ± SEM of six mice. Data represent three independent experiments. (A) Schematic view of the workflow. (B) Percentage of Thy1.2+CD4 T cells before transfer and those that maintain Foxp3 expression in the mesenteric LNs (mLNs) and spleens of recipient mice (n = 6). (C and D) Cytokine production from Thy1.2+ cells in the mLNs and spleens of recipient mice as determined by intracellular staining following 4 h of PdBU and ionomycin stimulation (n = 6). (E) Absolute number of Thy1.1+ effector T cells that produce IL-17 and IFN-γ in the mLNs and spleens of recipient mice (WT, n = 4; KO, n = 5). (F–I) EAE was induced in Mecp2f/y Foxp3–GFP–Cre (KO) or Mecp2x/y Foxp3–GFP–Cre (WT) littermate control mice by immunization with MOG peptide emulsified in CFA, and mice were killed at day 22 for cell analysis. (F) Clinical scores over time. (G) Area under curve (Right). (H) Percentage of Foxp3+ Tregs and MFI of Foxp3 expression in Foxp3+ Tregs from the spinal cord of WT or KO mice. (I) Percentage and number of CD4+Foxp3− cells that produce proinflammatory cytokines in spinal cords of WT and KO mice. All pooled data from F–I are represented as means ± SEM from three mice per group.

