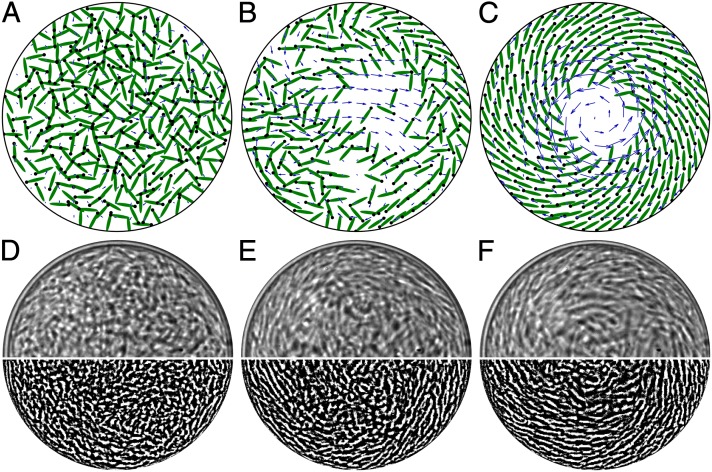
Fig. 1.
Snapshots of the bacterial suspension self-organization from simulations (A–C) and experiments (D–F). (A–C) An initially isotropic suspension of microswimmers inside a circle with diameter 12ℓ (ℓ = individual swimmer length). Black dots indicate the swimming direction. The swimmer-generated fluid flow is shown superimposed in each plot (blue arrows). (D–F) A dense suspension of B. subtilis in a drop, 70 μm in diameter. (Upper) Bright field. (Lower) Images processed by edge-detection filtering. Initial disordered state is obtained by shining a blue laser that causes cells to tumble. In both simulations and experiments, the suspension organization initiates at the boundary, as seen in B and E. See also Movie S1.

