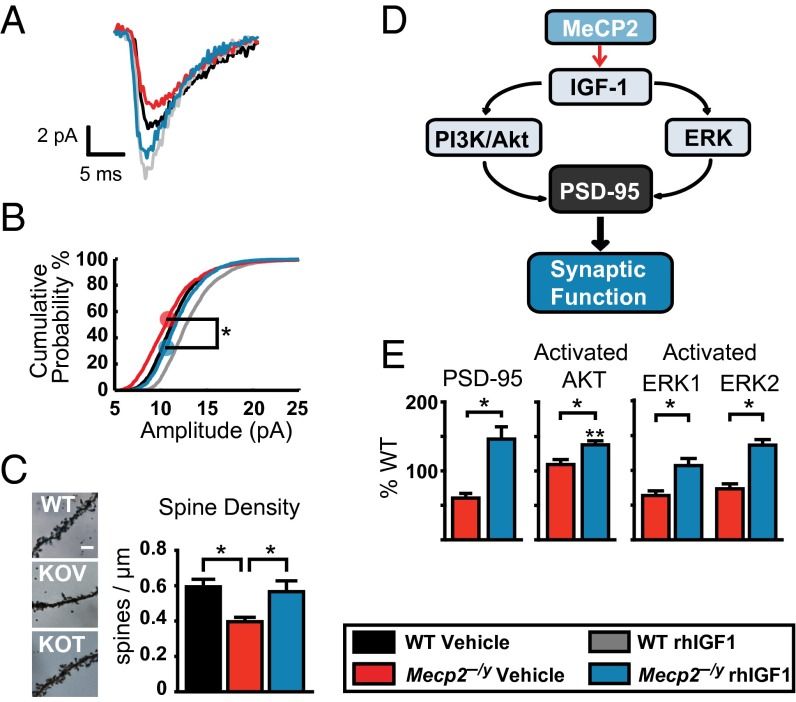
Fig. 3.
Effects of rhIGF1 on excitatory synaptic transmission, spine density, and signaling pathways. (A) Averaged mEPSCs from V1 layer 2/3 cells comparing peak amplitudes (events: WT vehicle, n = 270; WT rhIGF1, n = 816; KO vehicle, n = 354; KO rhIGF1, n = 268). (B) Distribution of mEPSC amplitude across all cells. rhIGF1 treatment significantly shifted the population distribution toward higher peak amplitudes (Kolmogorov–Smirnov test between vehicle and treated Mecp2−/y with pooled data from five to eight cells from three to four animals in each group). (C) Representative micrographs of basal dendrites in supragranular pyramidal neurons at P42 stained with Golgi and their synaptic spine density measurements (one-way ANOVA with Newman–Keuls post hoc analysis for multiple comparisons). (Scale bar, 5 μm.) (D) Schematic of proposed signaling pathways downstream of MeCP2-mediated IGF1 activation. (E) Quantification of PSD95 (Left) Western blots in synaptoneurosomes as a percentage of WT littermate control levels and the ratios between phosphorylated and total Akt (Center) and ERK1/2 (Right) in whole-cell homogenates. Ratios are based on Western blot protein measurements at P28 (comparisons used a one-way ANOVA with Newman–Keuls post hoc analysis for multiple comparisons including WT controls). *P < 0.05; **P < 0.01. Error bars represent SEM. See also Fig. S2.

