Fig. 1.
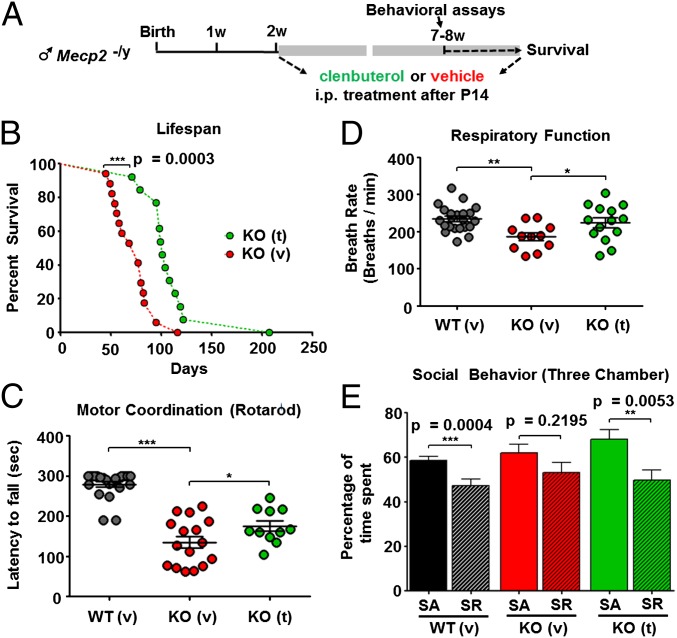
Treatment with clenbuterol substantially increases survival and improves behavior of Mecp2 KO mice. (A) Schematic showing the duration of clenbuterol treatment and time of behavioral assays in Mecp2−/y mice. (B) Graph showing cumulative survival distributions for KO vehicle [KO (v), red circles], and KO clenbuterol-treated [KO (t), green circles] mice. P value shown in graph is based on Gehan–Breslow–Wilcoxon test. (C) Graph showing mean ± SEM latency to fall rotarod motor coordination test values (in seconds) in WT vehicle [WT (v), black circles], KO vehicle [KO (v), red circles], and clenbuterol-treated [KO (t), green circles] mice during the second experimental day. (D) Graph showing mean ± SEM breath rate values (breaths per minute) for the three experimental groups. Stars in C and D depict statistical significance based on ANOVA with Newman–Keuls test for multiple comparisons (***P < 0.001, **P < 0.01, *P < 0.05). (E) Graph showing mean ± SEM percentage of time spent in the chamber with the Stimulus mouse for WT (v) (n = 29), KO (v) (n = 9), and KO (v) (n = 11) during the first (social approach or SA, filled bars) and second day (social recognition or SR, bars with diagonal lines) of the three-chamber test. The asterisks denote statistical significance based on two-tailed paired t test (***P < 0.001, **P < 0.01, with the exact P values depicted in the figure).

