
Fig. 3.
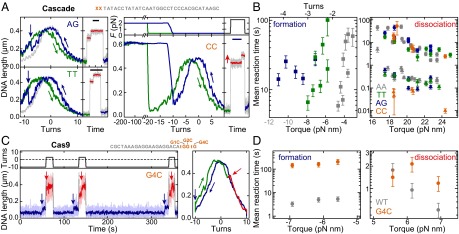
PAM mutations affect primarily R-loop formation and not dissociation. (A) Repetitive R-loop cycles in the presence of Cascade on DNA with the matching protospacer S1 but modified dinucleotide PAMs (see sketch above and labels in the graphs). Curve coloring and experimental conditions are as in Fig. 1 C and D. For the CC PAM, R-loop formation requires −200 turns (at 2.0 pN; blue curve). The shift in the probe curve (green) and the dissociation step (red curve) reveals the presence of the R-loop. (Scale bars: 10 s.) (B) Mean R-loop formation and dissociation times as a function of torque for the different PAMs (colors given in the key). Circles and triangles indicate the first and second dissociation step, respectively. Gray torque values indicate the phase where the torque is no longer proportional to turns. (C) Repetitive cycles of R-loop formation and dissociation by Cas9 (as in Fig. 2D) at 0.31 pN using a DNA with protospacer S2 and G4C PAM (see sketch). (D) Mean R-loop formation and dissociation times as a function of torque for the G4C PAM compared with the canonical PAM.