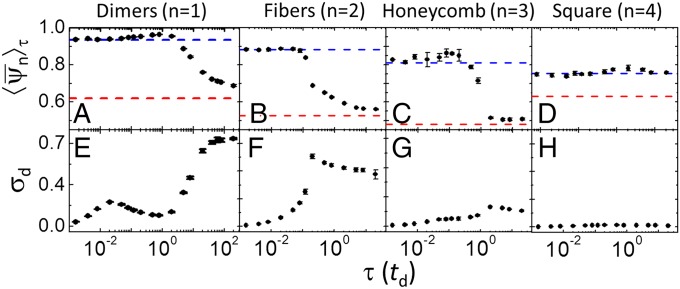
Fig. 5.
Characterization of the nonequilibrium order/disorder transition between dissipative structures for fast oscillations and oscillating structures for slow oscillations. (A–D) Period-averaged bond-order parameters, 〈ψn〉τ, as a function of the period of the oscillation, τ, for dimers, fibers, honeycomb lattice, and square lattice. The blue dashed line shows the value 〈ψn〉τ in the limit of very fast oscillations, obtained with the effective potential, Eq. 5. The red dashed line shows the value 〈ψn〉τ in the limit of very slow oscillations obtained from an average of 〈ψn〉τ determined for fixed-pH simulations in the pH range 3–7. (E–H) Energy dissipation per oscillation period (units of kBT) as a function of the oscillation period for the different morphologies. The values of C and ρ for each morphology are the same used for the snapshots in Fig. 3. Error bars show 1 SD from the average result of four independent simulations. A linear pH–time program (Fig. 3 B, i) has been used in these calculations.

