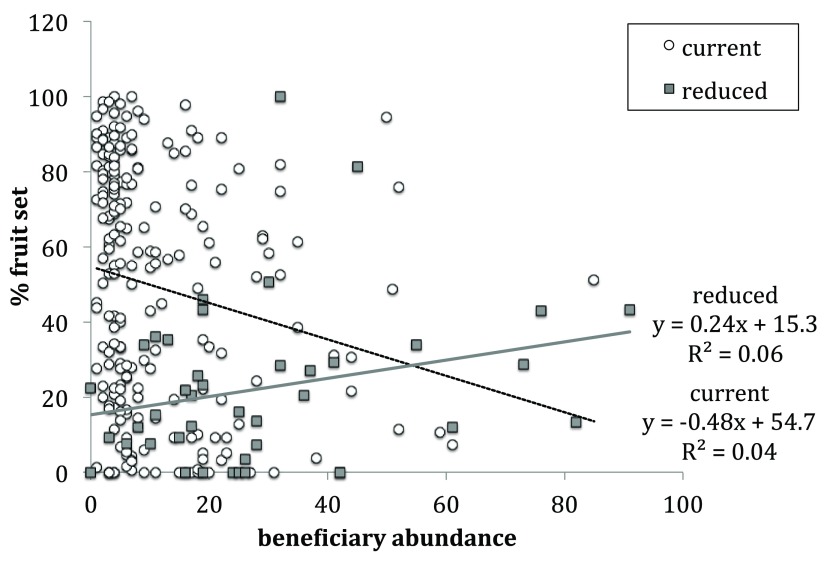
Figure 3. Percent fruit set and beneficiary abundance on individual S. acaulis plants under current pollination regime (white circles) and reduced pollination regime (grey squares).
The linear best-fit line for plants under current pollination regime (black dashed line) has a negative slope of -0.48 and R 2 value of 0.04. The linear best-fit line for plants under reduced pollination regime (grey line) has a positive slope of 0.24 and R 2 value of 0.06. The slopes of these lines significantly differ (Chi 2 161.25, p-value <0.0001).

