Figure 2.
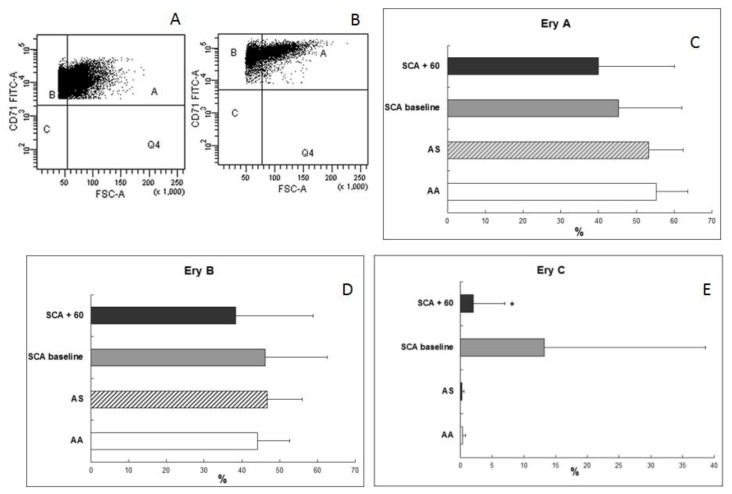
Flow cytometric analysis of erythroid subpopulations at the bone marrow level. (A, B) Primary bone marrow cells were simultaneously stained with CD71+CD45−. We distinguished erythroblast subpopulations (Ery A, Ery B, and Ery C) by considering, in addition to CD71, the forward scatter (FSC) parameter in the gated erythroid population. Ery A is CD71high FSChigh, Ery B is CD71high FSClow, and Ery C is CD71low FSClow. (A) Erythroid subpopulation in SCA patients at baseline. (B) Erythroid subpopulation in SCA patients 60 days post-transplant. (C–E) Comparison of percentages of Ery A, Ery B, and Ery C in SCA patients at baseline (gray bar), in SCA patients 60 days post-transplant (black bar) vs. normal donors (white bar) and AS trait carrier donors (dashed bar). The results are expressed as mean ± SD; * p= 0.0028.

