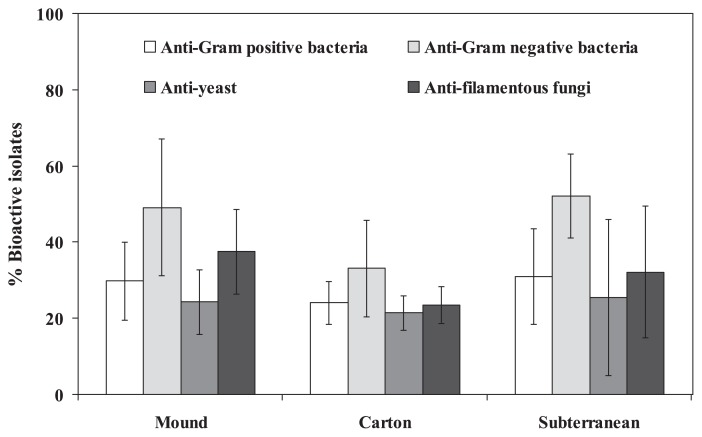
Fig. 4.
Percentage of the bioactive isolates of actinobacteria isolated from each type of termite nest. The bioactive isolates were quantified based on their capacity to inhibit the growth of at least one test organism. The graph was plotted by means ± SDs computed based on the data derived from different population numbers (numbers of termite nest samples) taken from Table 2. Statistical comparisons can be found elsewhere in this study.

