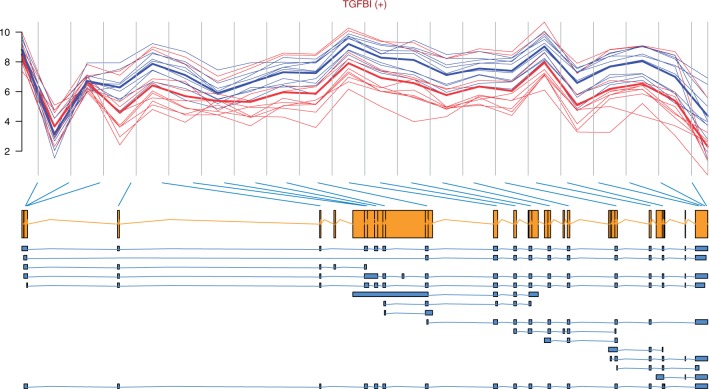
Figure 3:
Profile plot of TGFBI with the gene model and transcripts retrieved from Ensembl [50]. The gene is on the forward strand as indicated by (+) next to its name. The mean intensities of each group are plotted with a thicker line; note that only one estimate is plotted by probeset, and it corresponds to the estimate computed by ExonRmaPlm(…, mergeGroups=FALSE). Here, it seems like the tumour samples (blue/dashed) present increased expression from exon 3 until the end of the transcript, with respect to normal (red/solid) samples. Given that TGFBI is on the forward strand and that the difference is at the beginning of the transcript, we might be observing a case of alternative promoter usage.

