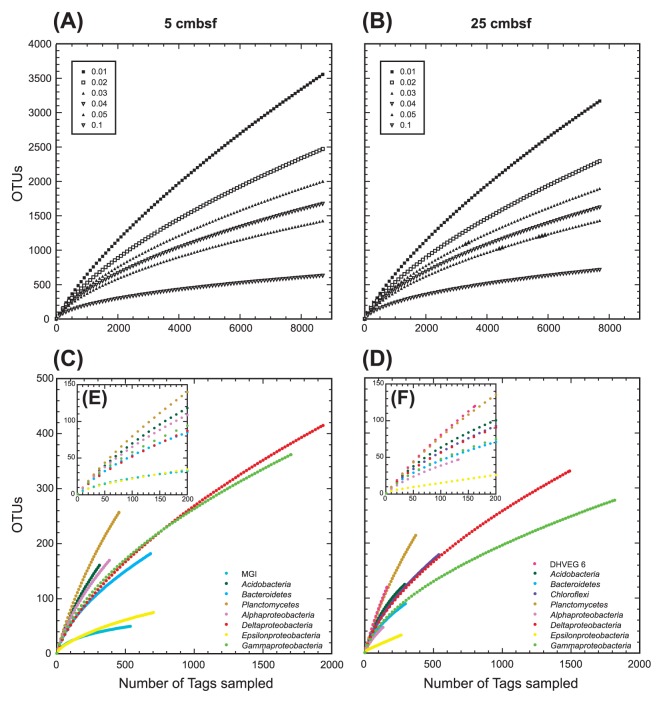
Fig. 4.
Rarefaction analysis for methane seep sediment samples from 5 and 25 cmbsf of sediment core 949C3 based on MOTHUR program. Rarefaction of whole microbial community is shown for OTUs with differences that do not exceed 1, 2, 3, 4, 5 and 10% (A and B). C and D show taxon/division-specific rarefaction for OTUs with <2% dissimilarity. E and F show rarefaction at <200 tags in C and D, respectively.

