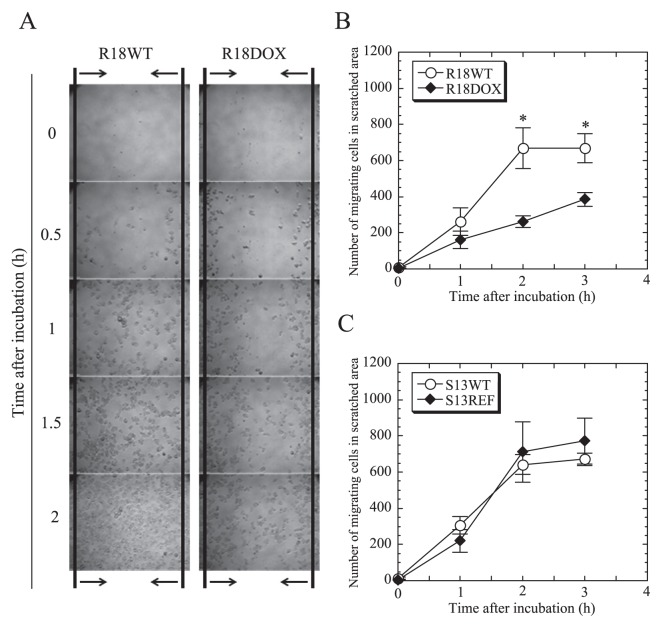
Fig. 3.
Influence of antibiotic treatment on amoebal motility.
(A) Representative motility images were captured for up to 3 h. The space between the arrows indicates the observed area. 100× magnification. (B and C) Comparison of the number of migrating amoebae [R18 amoebae (B), S13 amoebae (C)] in a scratched area. The data show the mean ± SD of at least three independent experiments. *P<0.05 vs. cultures with aposymbiotic amoebae (Student’s t-test).

