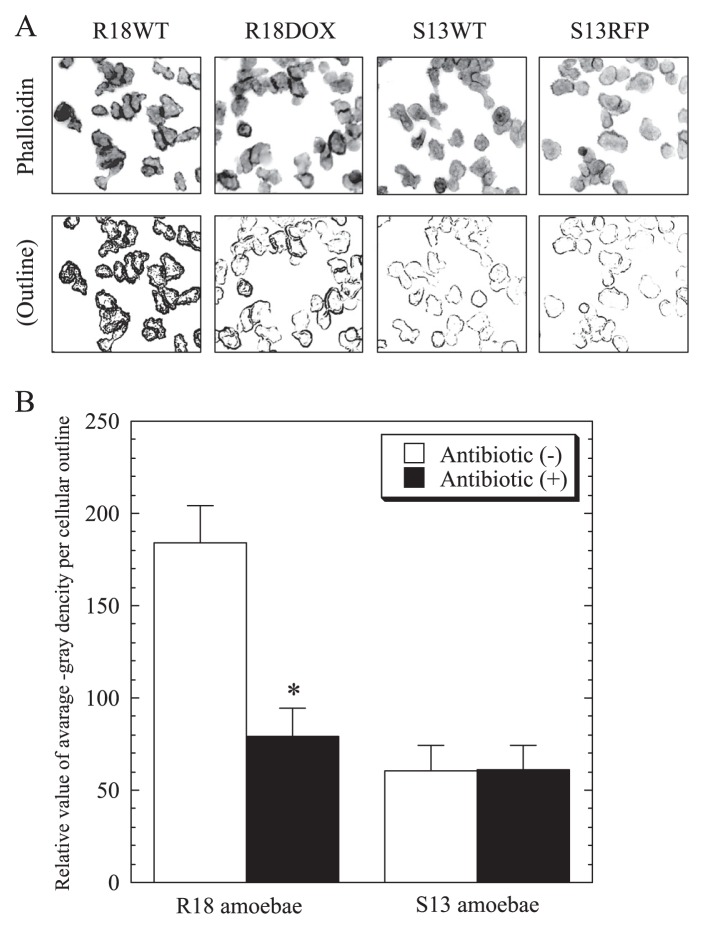
Fig. 4.
Comparison of phalloidin staining patterns between symbiotic (R18WT and S13WT) and aposymbiotic (R18DOX and S13RFP) amoebae.
(A) Representative phalloidin staining images of R18 and S13 amoebae before and after antibiotic treatment (upper panels) and the captured amoebal outline images converted to gray-gradual signals as described in Materials and Methods (lower panels); 200× magnification. (B) The relative value of averaged gray density per amoebal outline was compared between symbiotic and aposymbiotic amoebae. The data show the mean ± SD of at least three independent experiments. *P<0.05 vs. the value for the respective aposymbiotic amoebae (Student’s t-test).

