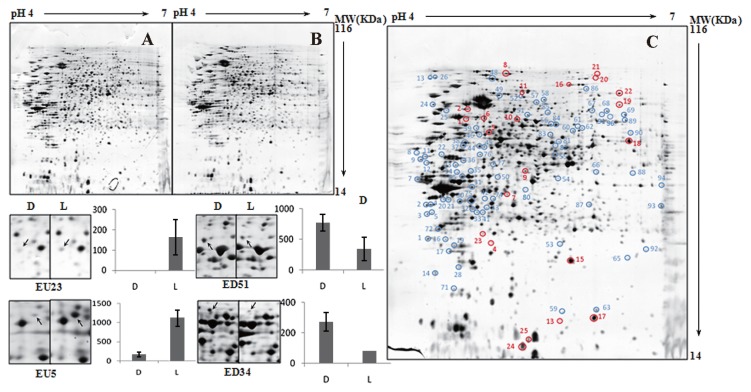
Fig. 5.
2D-GE image analysis of the R. litoralis OCh149 proteome in exponential phase under dark and light regimen treatments. (A, B) A set of two gels from samples treated with dark (A) and light (B) regimens. (C) A representative gel showing the identified differentially expressed proteins. Red, proteins up-regulated in light regimen. Blue, proteins down-regulated in light regimen. (D) Typical examples of spots showing different expression profiles. D, under dark condition. L, under light regimen.

