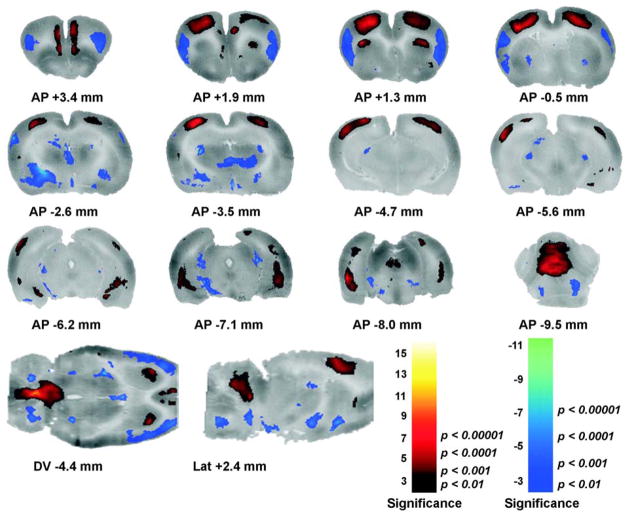
Fig. 3.
Changes in functional brain activity in rats in response to treadmill walking. Numbers below the slices indicate their position relative to bregma in millimeters according to a standard rat brain atlas (Paxinos and Watson, 1998). Depicted are coronal slices (anterior–posterior coordinates), a sagittal slice (+2.4 mm lateral to bregma) and a transverse brain slice (−4.4 mm dorsoventral to bregma). Colored overlays show statistically significant positive (red) and negative (blue) differences of ambulatory animals (n = 7) compared to controls (n = 6). Significance is shown with a t statistic color scale, which corresponds to the level of the significance at the voxel level.

