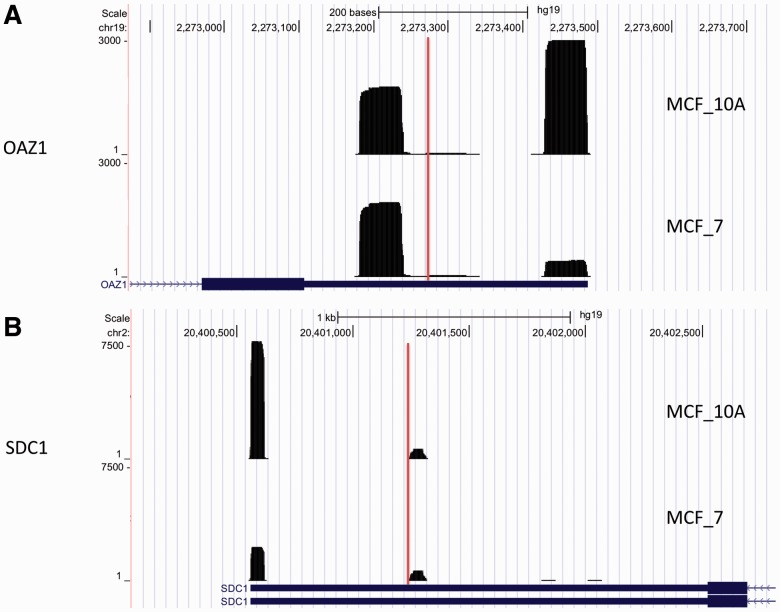
Fig. 5.
Examples of two shortening events that were identified by our method but missed by the linear trend test. The vertical lines indicate the change points predicted by our proposed model. We observed a clear change before and after the predicted change points, suggesting that our proposed method work well to detect 3′UTR switching without relying on any polyA annotation information. The two genes OAZ1 and SDC1 tend to use the shorter isoform in the MCF_7 cancer cell line in comparison with the control sample MCF_10A, and demonstrated clear shortening patterns

