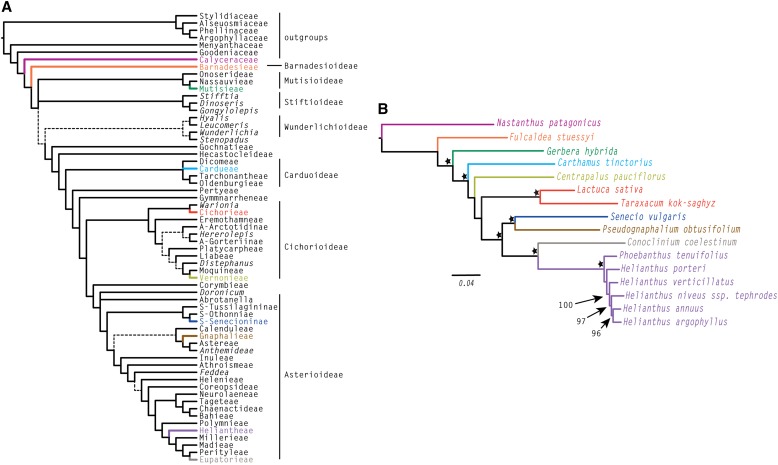
Fig. 1.
Compositae base tree and COS loci tree. (A) Summary of 10-locus chloroplast tree for ca. 900 genera redrawn from Funk et al. (2009). (B) Maximum likelihood tree based on 763 COS loci. Species sampled in our study are colored the same as their tribe in (A). Bootstrap values greater than 75% are indicated with a star. Bootstraps for the Heliantheae-only data set are given in numeric values with arrows. Note that within the Heliantheae-only data set, Phoebanthus was used as the outgroup so no support value is given for the node distinguishing it and the Helianthus species.

