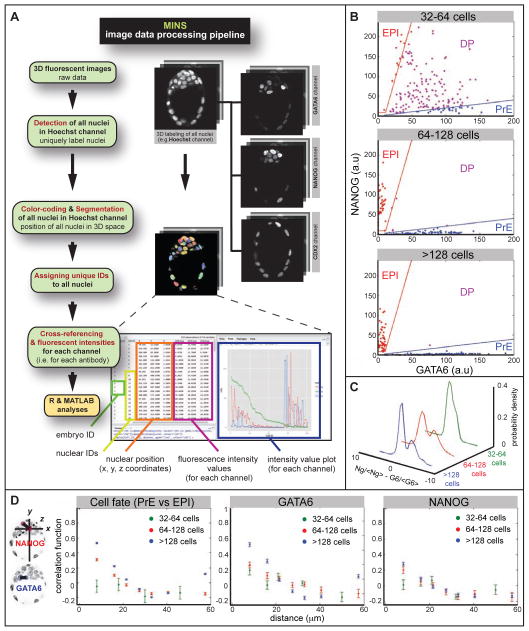
Figure 1. Quantitative analysis of GATA6 and NANOG expression.
A Image data processing pipeline incorporating MINS software. B Nuclear concentration of GATA6 and NANOG at different stages. Blue and red lines show the threshold function used to define cells as PrE and EPI precursors respectively. Cells that do not fall in either group are co-expressing NANOG and GATA6, and are classified as DP (double positive, uncommitted ICM) cells. C Probability density of normalized GATA6 concentration minus normalized NANOG concentration (<G6> and <Ng> indicate the average concentrations of GATA6 and NANOG, respectively). Earliest stage (defined by total cell number N) cells express both GATA6 and NANOG (unimodal distribution), but at the “salt-and-pepper” stage cells are either GATA6-positive or NANOG-positive, resulting in a bimodal distribution. D Correlation coefficient of cell fates and of levels of GATA6 and NANOG as a function of cell-cell distance for three different stages. Correlation = 0, cells are making their fate choice independent of other cells, no fate prediction can be made; correlation =1, certain prediction that cells with close distance are alike; Correlation = −1, certain prediction that cells with close distance are unalike.

