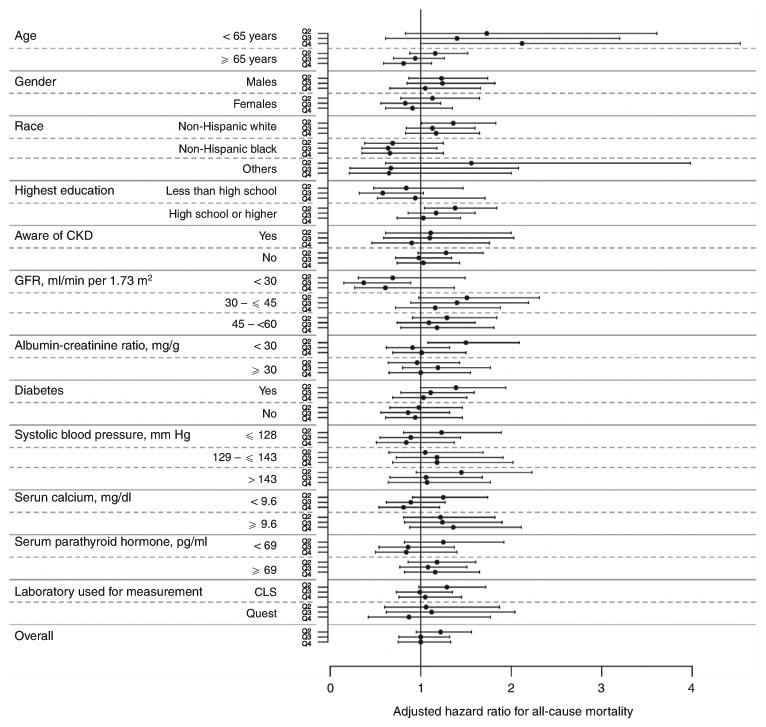
Figure 2. Forest plot showing hazards ratio with 95% confidence interval for the association between quartiles of serum phosphorus and all-cause mortality in subgroups based on 12 variables and in the entire study population.

The range of serum phosphorus for each of the four quartiles were: quartile 1, <3.3 mg/dl (reference); quartile 2, >3.3 to 3.7 mg/dl; quartile 3, >3.7 to 4.1 mg/dl; and quartile 4, >4.1 mg/dl. All analyses are adjusted for the following covariates (except for the variable used to define the subgroup in each case): age, gender, race/ethnicity, year of screening, diabetes, hypertension, dyslipidemia, current tobacco use, body mass index, estimated glomerular filtration rate (eGFR), albuminuria, plasma glucose, calcium, parathyroid hormone, hemoglobin, chronic kidney disease (CKD) awareness, and health insurance.
