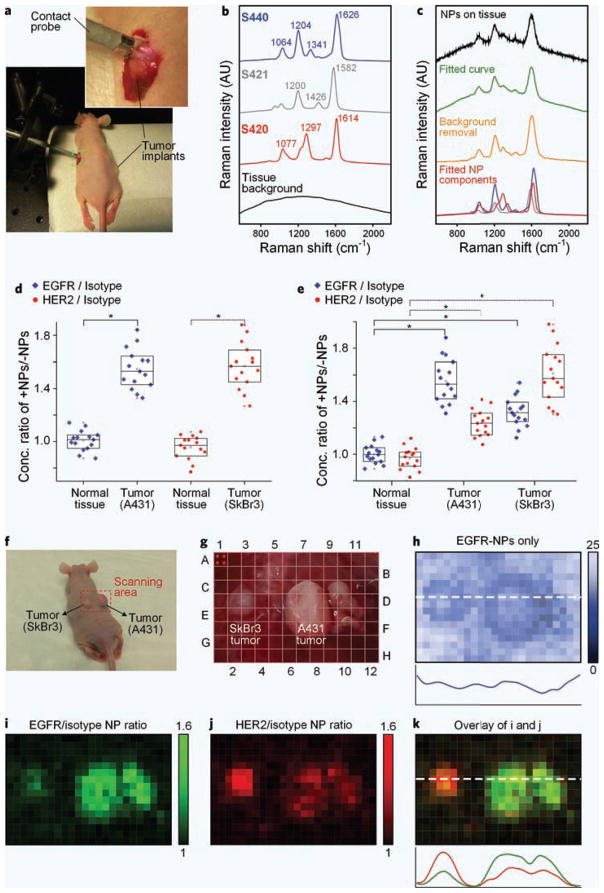
Figure 5.
In vivo ratiometric analysis of multiplexed NPs on tumor implants. (a) Mouse with surgically exposed tumors; the inset provides a magnified view of the 2.5-mm diameter flexible Raman probe. (b) Reference Raman spectra of pure SERS NPs (red: S420, gray: S421 and blue: S440) and tissue background with no NPs (black). (c) Raw spectra of NPs applied on tissue acquired with a 0.1-s integration time (black), best-fit curve using a DCLS algorithm (green), spectra of NPs on tissue after tissue-background removal using a DCLS algorithm (orange), and the DCLS-demultiplexed NP spectra (blue: EGFR-S440, red: HER2-S420, gray: isotype-S421). The concentration ratio of targeted and nontargeted NPs topically applied on exposed tumors and normal tissues is plotted for (d) 2-flavor and (e) 3-flavor multiplexed NPs (n = 15). *P-value < 0.001. (f–k) Image-grid experiment. (f) Mouse with two adjacent tumor xenografts. (g) Photograph of stained tissue with a virtual grid of detection locations. Four positions were probed within each grid coordinate (e.g. refer to the red dots in coordinate A1) such that 24 × 16 positions were detected in total; (h) Map of the absolute concentration (pM) of EGFR-NPs; (i) Map of the concentration ratio of EGFR/isotype NPs. (j) Map of the concentration ratio of HER2/isotype NPs. (k) Overlay of EGFR/isotype and HER2/isotype maps.

