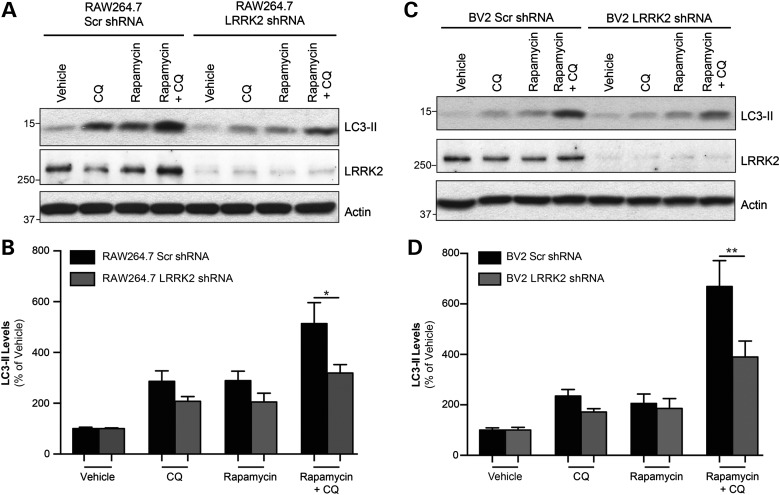
Figure 6.
Knockdown of endogenous LRRK2 decreases LC3-II levels and flux in monocytes. (A) Representative blot of RAW264.7 Scr and LRRK2 KD cells treated with rapamycin for 16 h to activate autophagy, with some cells being treated CQ (20 μm) for the last 6 h to prevent autophagic degradation of LC3-II for analysis of flux. (B) Analysis of LC3-II levels determined by densitometry, expressed as a percentage of vehicle-treated Scr cells. Graph is a compilation of three independent experiments, performed in duplicate (n = 6; *P < 0.05). (C) Representative blot of BV2 Scr and LRRK2 KD cells, treated as in (A). (D) Histogram of LC3-II levels in BV2 cells, derived from three independent experiments, performed in duplicate (n = 6; **P < 0.01).

