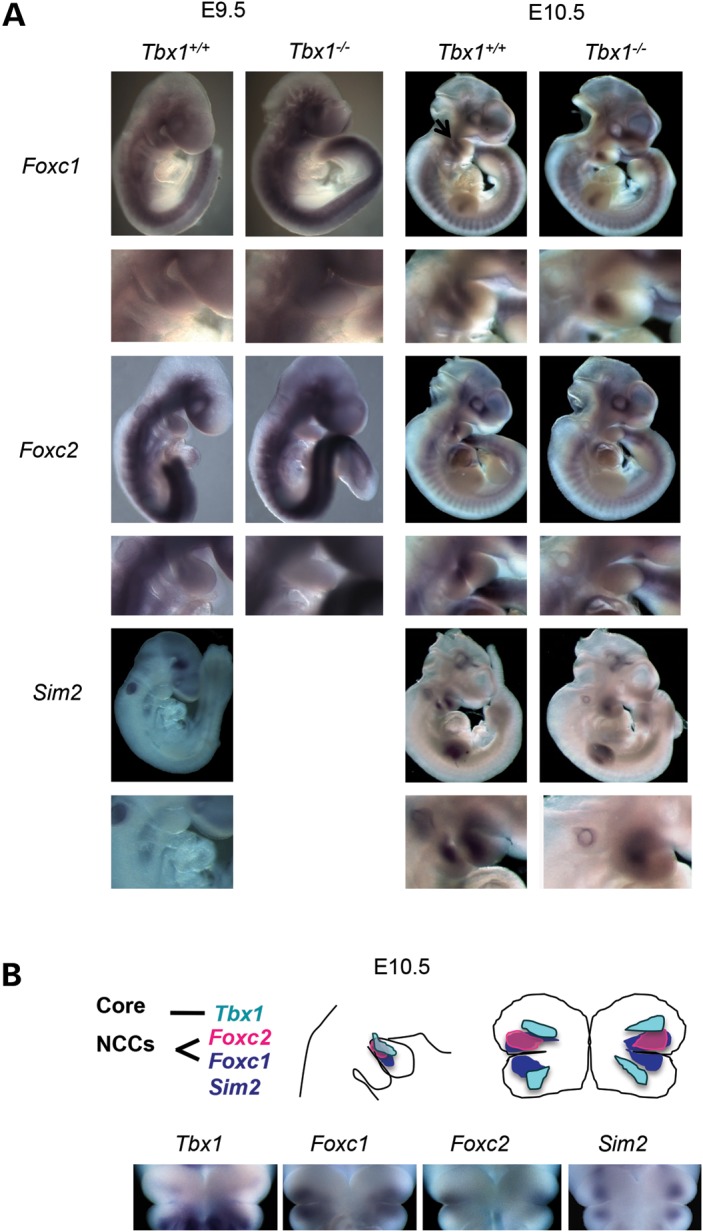
Figure 4.

Foxc1, Foxc2 and Sim2 expression in PA1 in Tbx1+/+ versus Tbx1−/− embryos at E9.5 and E10.5. (A) Lateral views of whole-mount in situ hybridization of probes for Foxc1, Foxc2 and Sim2 in Tbx1+/+ and Tbx1−/− embryos at E9.5 and E10.5. Enlarged lateral views of the PA1 region in the whole-mount specimens is shown below each whole embryo view. (B) Cartoon of lateral and coronal views (shown below) of Tbx1, Foxc1, Foxc2 and Sim2. Expression domain of Tbx1 is in the core mesoderm.
