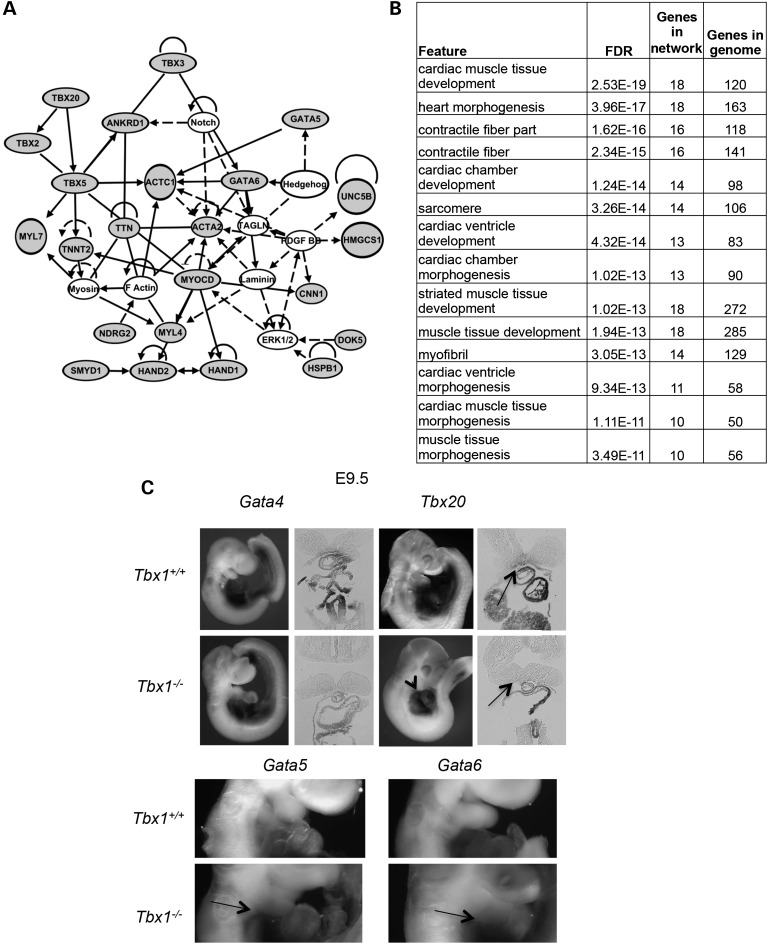
Figure 5.
Ectopic expression of cardiac genes in PA1 in Tbx1+/+ versus Tbx1−/− embryos at E9.5. (A) The network downstream of Tbx1 was created using genes that had a >1.5-fold increase, P < 0.05 by microarray analysis (gray fill). Genes not changed in expression significantly in the microarray or qRT–PCR assay, but connected to those based upon the software generated connections, are indicated as uncolored circles. The lines indicate relationships between genes that could be direct or indirect in nature. Genes increased in expression but not linked to the network were removed but can be found in the Supplementary Material, Table S1. (B) Genes increased in expression in Tbx1−/− embryos at E9.5 were analyzed at the Genemania website to identify top enriched functions. We provide the FDR score estimated in Genemania by the Benjamini–Hochberg correction. (C) Whole-mount in situ hybridization was performed on in Tbx1+/+ versus Tbx1−/− embryos at E9.5 with probes to the genes indicated. Tissue sections are shown adjacent to whole embryo images. The arrows in Tbx20 images point to regions of ectopic expression. Regions of ectopic expression of Gata5 and Gata6 in Tbx1+/+ versus Tbx1−/− embryos are shown as arrows in the cropped images.

