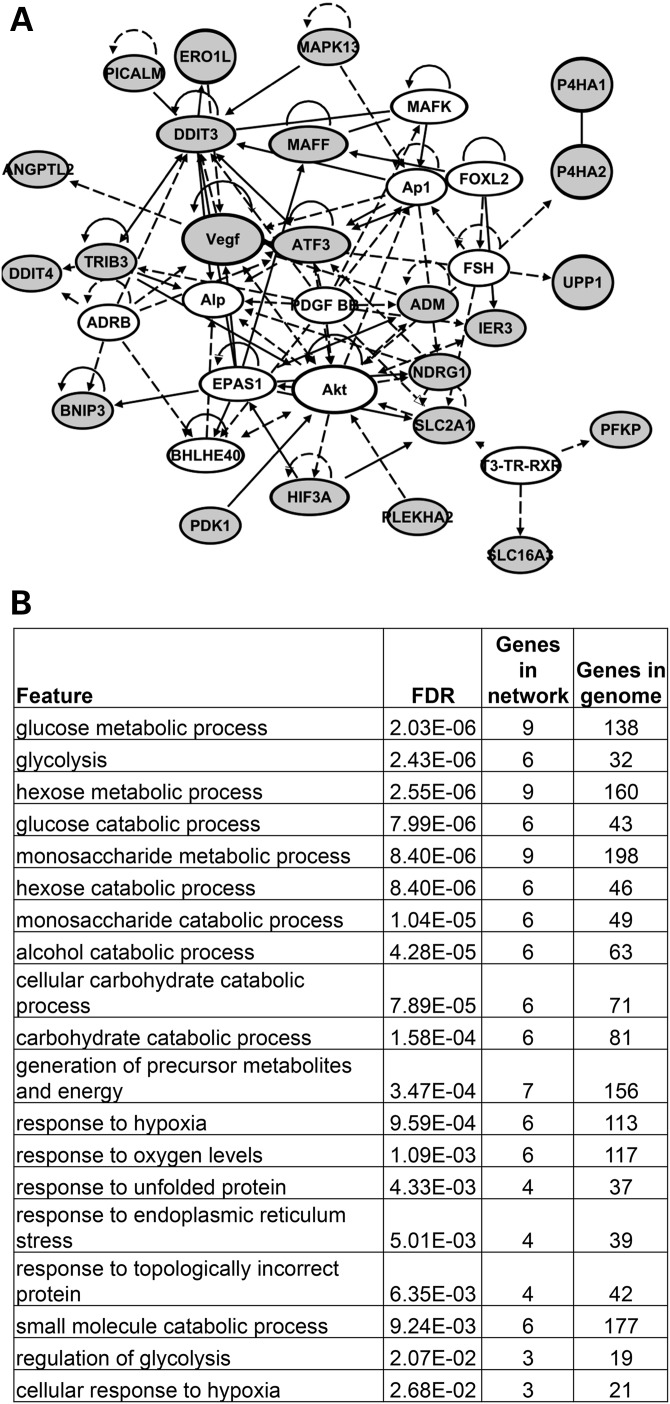
Figure 6.
Ectopic expression of hypoxia and stress response pathway genes in PA1 in Tbx1+/+ versus Tbx1−/− embryos at E10.5. (A) The network of genes that were reduced in expression in Tbx1−/− embryos when compared with Tbx1+/+ embryos (>1.5-fold change, P < 0.05) was created using IPA. The top network is depicted here. The genes increased in expression are highlighted in orange. The lines indicate relationships between genes that could directly or indirectly interact. Genes increased in expression but not linked to this network can be found in the Supplementary Material, Table S2. (B) Genes increased in expression in Tbx1−/− embryos at E10.5 were uploaded to the Genemania website to identify top enriched functions.

