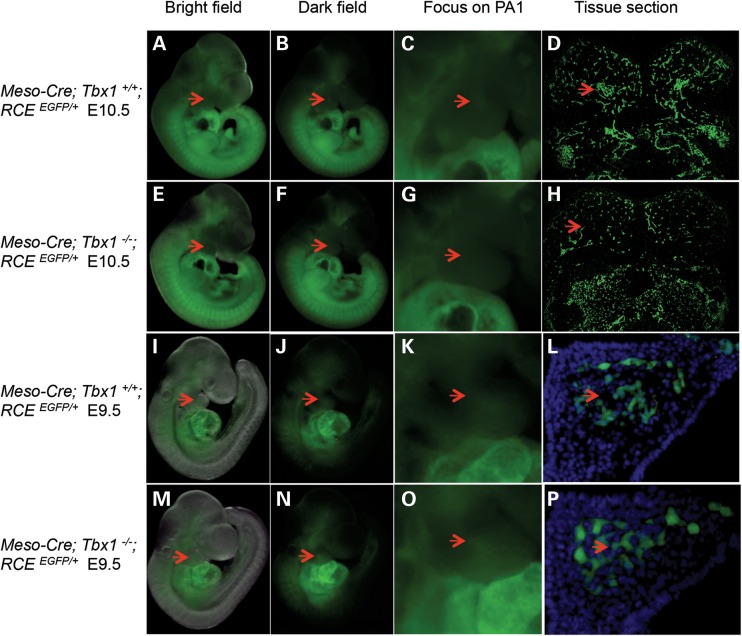
Figure 7.
Mesodermal fate mapping in Tbx1+/+ versus Tbx1−/− embryos at E9.5 and E10.5. Mesodermal fate mapping was performed using Mesp1Cre with T-Cre alleles and RCEEGFP/+ mice in Tbx1+/+ versus Tbx1−/− littermates at E9.5 (I–P) and E10.5 (A–H). Lateral views of Tbx1+/+ (A–D and I–L) and Tbx1−/− (E–H and M–P) mutants are shown as bright (A, E, I and M) and darkfield (B, F, J and N) views. The red arrow points to the region of the presence or absence of core mesodermal tissue in Tbx1+/+ versus Tbx1−/− at E9.5 and E10.5. An enlarged image of the PA1 region is shown to the right of the images (C, G, K and O). On the far right are coronal cryosections of the same embryos depicting the core mesodermal cells (D, H, L and P). Dapi stain was used to visualize PA1 at E9.5 (L and P).

