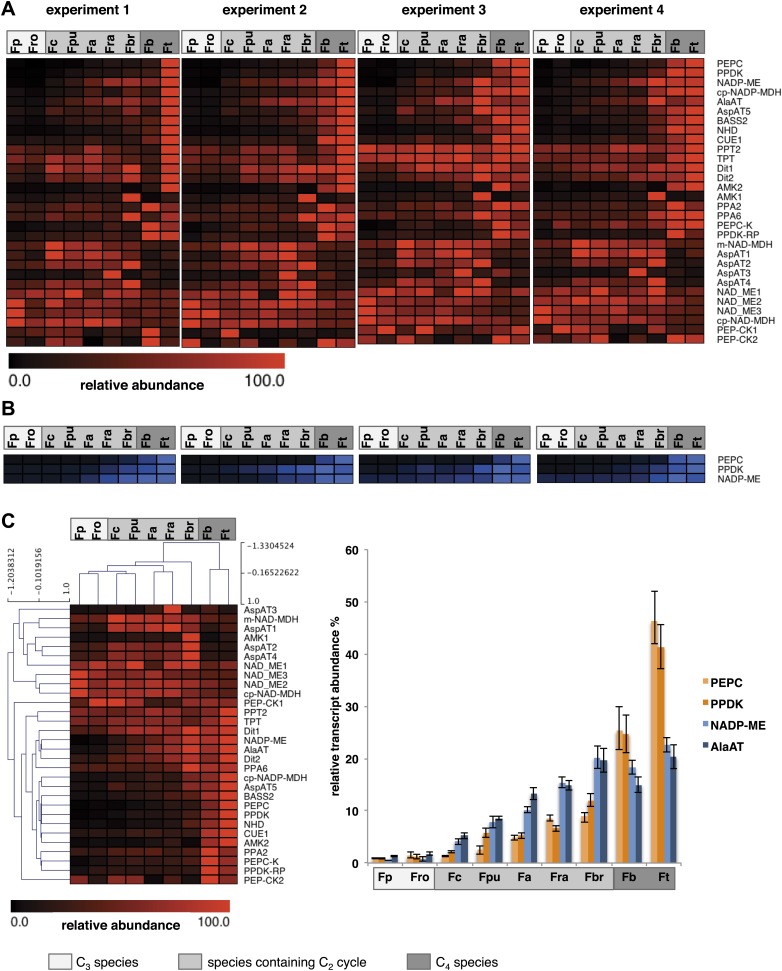
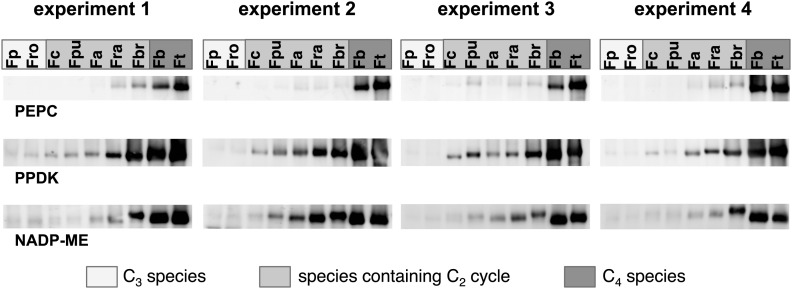
Figure 6. Abundance of C4 related transcripts and proteins in leaves of individual Flaveria species.
Normalized transcript (A) and protein (B) levels are plotted as heat maps. Transcript amounts were determined by Illumina sequencing of the leaf transcriptomes and read mapping on selected F. robusta full length transcript sequences. Protein amounts were determined by protein gel blots. See Figure 6—source data 2 for absolute transcript level, Figure 6—source data 2 for protein quantification and Figure 3—figure supplement 1 for immunoblots. (C) Mean values of transcript levels from all four experiments were clustered by hierarchical using the HCL module of MEV program with Pearson correlation and the average linkage method. The relative transcript abundance for PEPC, PPDK, NADP-ME and Ala-AT (mean values from all four experiments) are plotted for all nine species. Fp: F. pringlei (C3); Fro: F. robusta (C3); Fc: F. chloraefolia (C3–C4); Fpu: F. pubescens (C3–C4); Fa: F. anomala (C3–C4); Fra: F. ramosissima (C3–C4); Fbr: F. brownii (C4–like); Fb: F. bidentis (C4); Ft: F. trinervia (C4).
DOI: http://dx.doi.org/10.7554/eLife.02478.016


