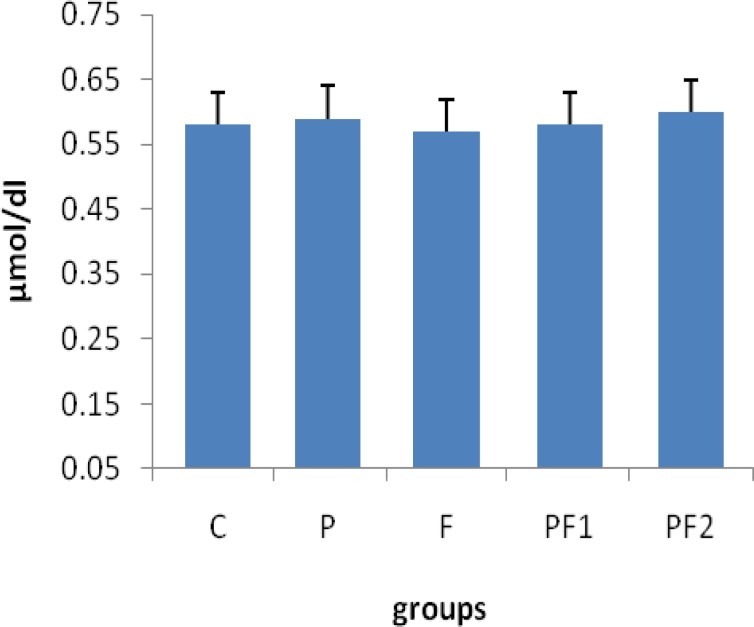
Figure 1.
Serum creatinine levels in different groups. Data are expressed as mean±SEM. Each group consisted of 8 animals. C: non PCOS control rats, P: PCOS rats, F: non PCOS control rats received F. vulgare aqueous extract at 150 mg/kg b.w., PF1: PCOS rats were treated with F. vulgare at 150 mg/kg b.w., PF2: PCOS rats administrated with F. vulgare at 100 mg/kg b.w. There was no significant difference in serum creatinine

