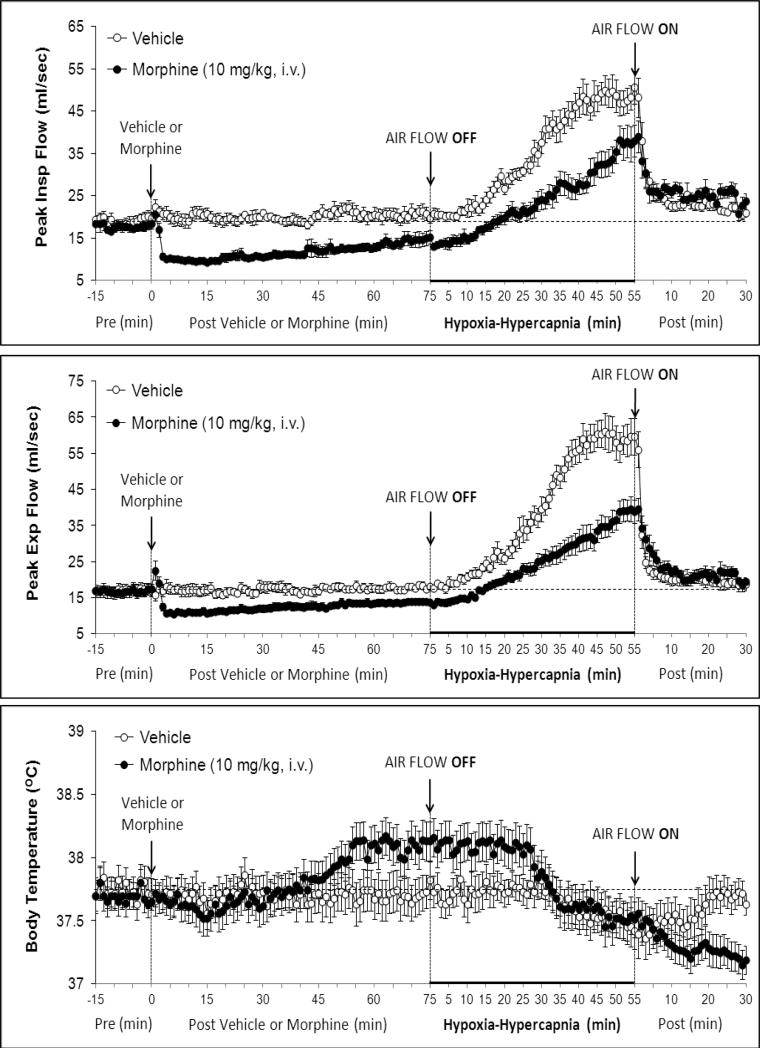
Figure 3.
Changes in peak inspiratory flow (upper panel), peak expiratory flow (middle panel) and body temperature (bottom panel) elicited by injections of vehicle or morphine (10 mg/kg, i.v.) and subsequent exposure to Hypoxia-Hypercapnia (air flow off) and return to room-air (air flow on). The data are presented as mean ± SEM. There were 6 rats in each group.

