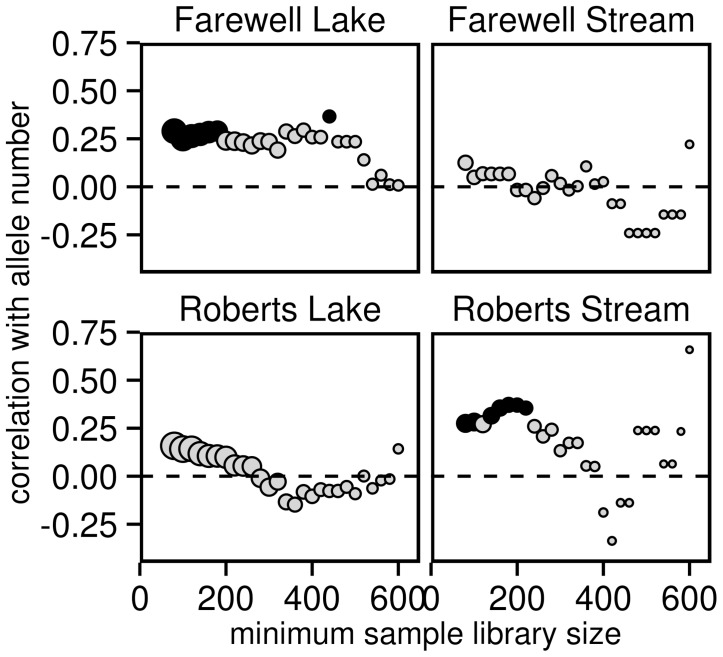
Figure 6. Changes in the correlation between library size and allele number with different minimum sample library sizes.
The correlation coefficients shown in figure 5 were recalculated at increasing minimum sample library sizes. Black circles denote statistically significant (α = 0.05) correlations, whereas gray circles denote statistically insignificant correlations. The dotted line indicates a correlation of zero. The size of the circles is proportional to the sample size for each correlation.

