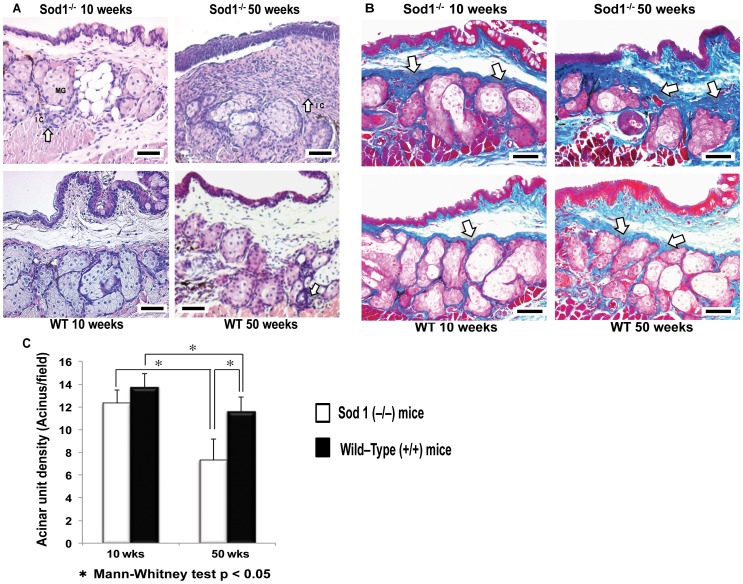
Figure 2. Meibomian gland histopathological alterations and tissue fibrosis in the Sod1 −/− and wild type mice.
A, Representative images for meibomian glands from the 10 and 50 week Cu, Zn-Superoxide Dismutase-1 knockout (Sod1 −/−) and wild type (WT) mice show normal meibomian gland acinar units morphology. Note the extensive periglandular inflammatory infiltration, and meibomian gland changes in the Sod1 −/− mice at 50 weeks. Bar = 50 micrometer. B, Mallory stainings show increased fibrosis (dark blue stained areas) from 10 to 50 weeks in the Sod1 −/− mice. Similar changes were observed in the WT mice but not to the extent observed in the Sod1 −/− mice. Bar = 50 micrometer. C, Meibomian gland acinar unit density significantly decreased from 10 to 50 weeks in both Sod1 −/− mice and the WT mice (p = 0.0007 and p = 0.0175, respectively). Meibomian gland acinar unit density was also significantly lower in the Sod1 −/− mice compared to the WT mice at 50 weeks (p = 0.0003). Five tissue sections of each mouse eye were analyzed to produce the meibomian gland acinar unit density values. Data represent the mean ± standard deviation for at least 7 mice from the Sod1 −/− groups and 10 mice from the WT groups, at 10 and 50 weeks. Five tissues sections from each eye of 7 animals (5 images per animal's eye) for each group were analyzed to produce the representative Mallory staining images.

