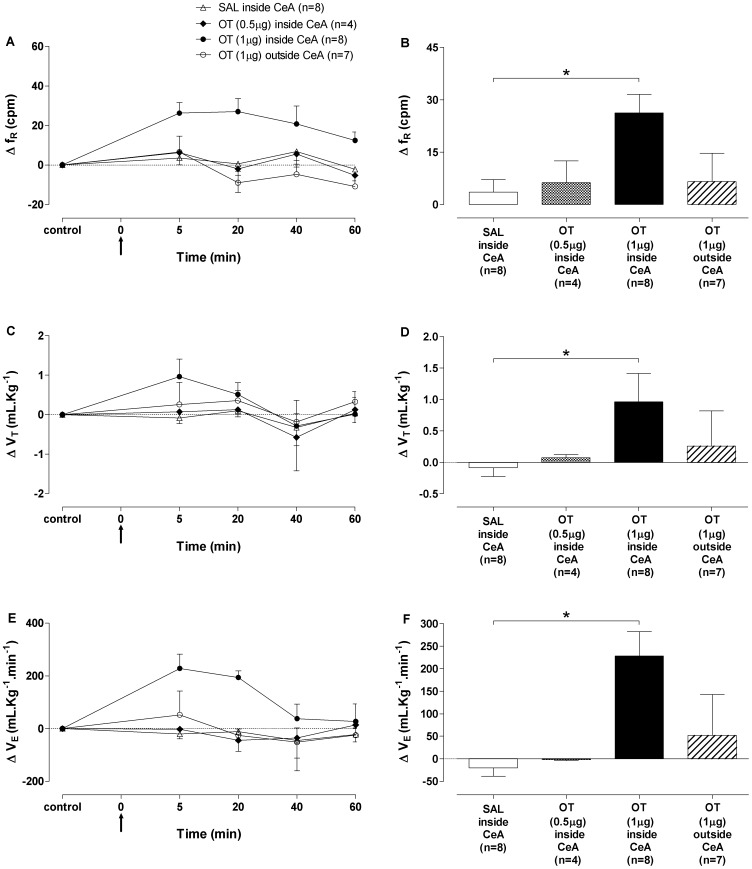
Figure 4. Respiratory responses to oxytocin microinjection into the central nucleus of amygdala.
(A) Time-course of respiratory frequency (ΔfR, cpm), (C) tidal volume (ΔVT, mL.Kg−1) and (E) minute ventilation (ΔVE, mL.Kg−1.min−1) changes for 60 min after bilateral microinjections of oxytocin (OT) 0.5 µg, OT 1 µg or saline (SAL) into the central nucleus of amygdala (CeA) group and OT 1 µg outside CeA group. Maximum responses in (B) respiratory frequency (ΔfR, cpm), (D) tidal volume (ΔVT, mL.Kg−1) and (F) minute ventilation (ΔVE, mL.Kg−1.min−1) 5 min after bilateral microinjections of OT 0.5 µg (black-white bar), OT 1 µg (black bar) or SAL (open bar) inside CeA group and OT 1 µg outside CeA group (striped bar). The arrow indicates the moment of microinjections. Data shown represent the means ± standard error of mean. (*) SAL inside CeA group vs OT 1 µg inside CeA group; p<0.05, Two-way ANOVA followed by Bonferroni's post hoc test.

