
Fig. 2.
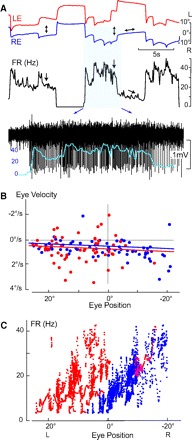
Ipsilateral right side HPNI neuron during spontaneous fixation behavior. A: LE and RE positions, FR (Hz) and neuronal activity of a right-side (ipsilateral) HPNI neuron with monocular eye positions indicated arrows. Neuronal activity is overlain by the expanded FR curve. B: P-V plot showing a τ for LE of 111.5 s and RE 124.5 s. C: plot of FR vs. eye position in which the coefficients for the LE were −0.52 (spike/s)/° and −0.41 (spike/s) per °/s, (r = 0.48) and the RE −1.59 (spike/s)/° and −0.30 (spike/s) per °/s, (r = 0.83).