
Fig. 4.
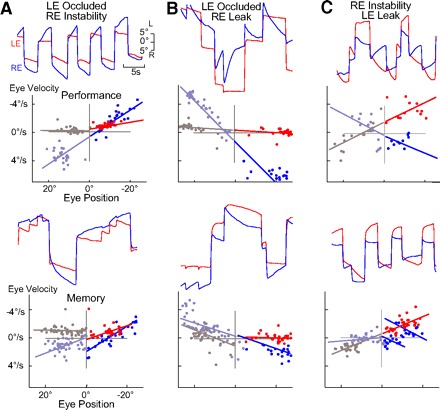
Monocular modification of integrator time constants. A–C: P-V plots and eye position records after training during performance (top) and memory (bottom) of monocular changes in the integrator time constant with + and − values indicating leak and instability, respectively. A: 6 h after the τ for RE (blue) instability performance was −5.2 s and for the occluded LE (red) −127.0 s. RE instability memory was −14.5 s and LE occlusion −194.4 s. B: τ for RE leak performance after 4 h was 3.5 s and LE stability 57.8 s. RE leak memory was 10.9 s and LE stability 107.2 s. C: τ for RE leak performance at 3 h was 7.3 s with LE instability at 8.1 s. RE memory leak was 43.2 s and LE instability −8.4 s.