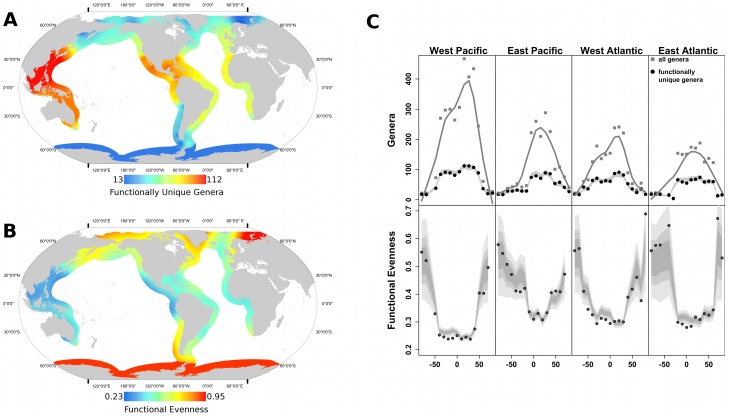
Figure 1. Global patterns in Functional richness (FR) and Functional evenness (FEve) for marine bivalves.
Heatmaps are interpolated from data for 10° latitudinal bands for (A) FR and (B) FEve. (C) Raw observations are plotted against latitude, showing the LDG in taxonomic richness (top, gray squares and black line), functional richness (top, black circles and gray line), and functional evenness (bottom). For both plots, the region in pale gray represents the central 95% of FRs or FEves from 1000 random draws for each latitude/coast combination. Observed FR and FEve are both broadly consistent with the null expectations given the taxonomic richness of each bin, and thus consistent with the high-latitude fauna being an attenuated sample of the global genus pool.

