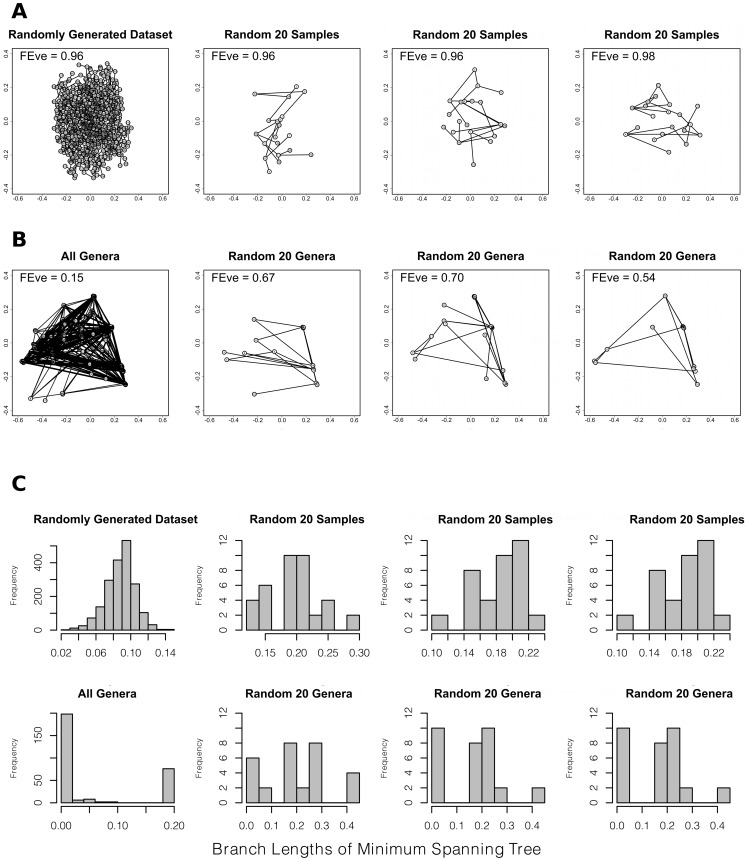
Figure 3. Random sampling of even and uneven taxon pools.
FEve is calculated from branch lengths of the minimum spanning tree (MST) connecting all taxa in a functional ordination [15]. When a taxon pool with low FEve is randomly sampled, the samples have higher FEve, as illustrated here. Panels A and B are PCoA plots with MSTs superimposed. For both panels, the left-most plot shows a taxon pool while the three right-most plots show three random samples from that pool. Panel A shows a randomly generated dataset, having the same dimensions as the bivalve genus data — a very even taxon pool. Randomly sampling from an even pool does not alter the evenness. Panel B shows data for all bivalve genera — an uneven taxon pool. Randomly sampling from an uneven taxon pool causes FEve to increase. (The pattern holds for 1000 random samples, as shown in Figure 1C). Panel C shows the distribution of MST branch lengths for each of the 8 plots in panels A-B. Despite the highly skewed distribution of branch lengths for the pool of all genera, samples from that pool have a relatively more even distribution of branch lengths than seen in the entire pool.

