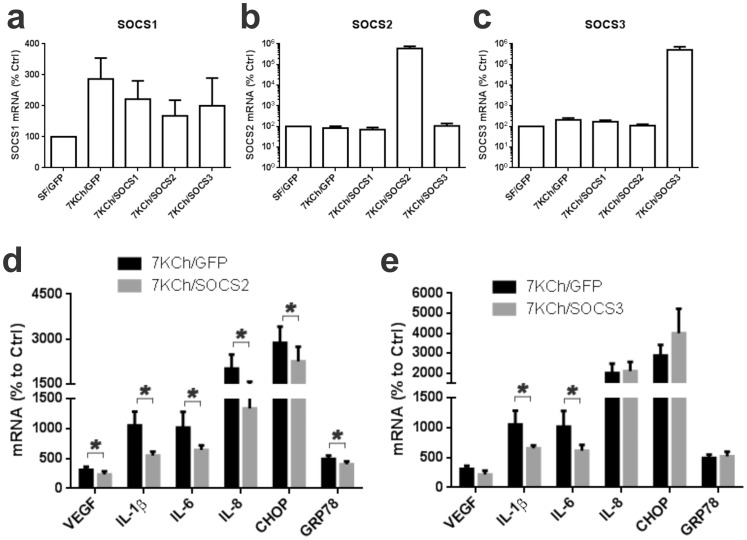
Figure 18. SOCS overexpression and its effect on 7KCh-induced inflammation.
ARPE19 cells were transduced with commercially available adenoviruses coding for SOCS1-3 and GFP. The adenovirus coding for GFP was used as control. Cells were then treated with 8 µM 7KCh for 24 hr and the SOCSs mRNA levels measured by qRT-PCR. The Y-axis in in log base 10. (a) Measurement of SOCS1 after transduction SOCS1-3 viruses with and without 7KCh treatment. 7KCh induced SOCS1 mRNA but the transduction with the SOCS1 virus did not have a significant effect on the mRNA levels. (b) 7KCh had no effect on the induction of SOCS2 but the virus increased the mRNA levels by 3-fold. (c) 7KCh had no effect on the induction of SOCS3 but the virus increased the mRNA levels by 3-fold. ARPE19 were transduced cells with adenoviruses for SOCS2 and 3 then treated with 8 µM 7KCh for 24 hr. The mRNA inductions of the inflammatory markers were measured by qRT-PCR (mean ± s.d., n = 4). (d) Measurements with and without SOCS2 overexpression. SOCS2 overexpression suppressed the 7KCh induction of VEGF (3.1 to 2.3 fold), IL-1β (10.5 to 5.5 fold), IL-6 (10.2 to 6.4 fold), IL-8 (20.1 to 13.3 fold), CHOP (28.7 to 22.6 fold), and GRP78 (4.9 to 4.0 fold). (e) Measurements with and without SOCS3 overexpression. Overexpression of SOCS3 suppressed the 7KCh induction of IL-1β (10.5 to 6.5 fold) and IL-6 (10.2 to 6.1 fold), but had no effect on the other markers. *p<0.05, two-tailed Student's t-test.

