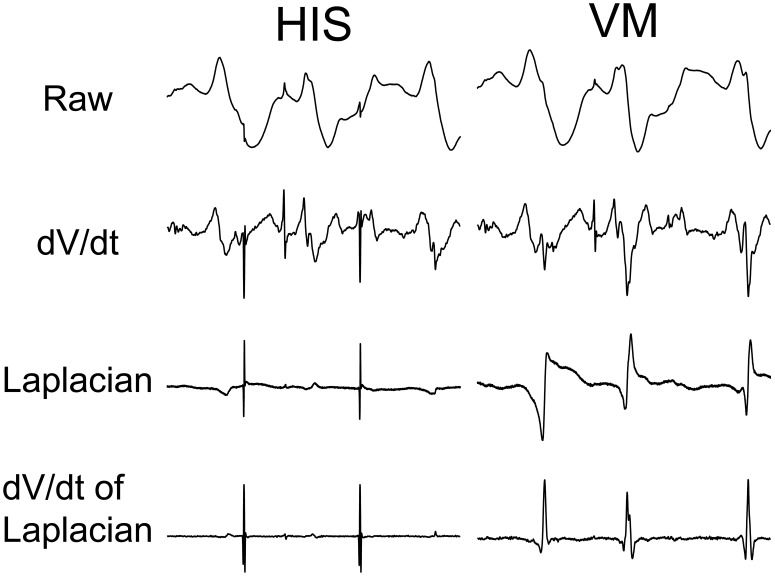
Figure 2. Signal processing to detect activation times for His and VM signals.
His and VM signals were recorded at the location 2 and 3 from Figure 1A, respectively. The raw electrograms contain little information to detect activation times. The 21-point dV/dt of the electrograms shown above contains too much far field activation for robust local activation time detection. The Laplacian isolates the strongest local signal, attenuating far field signals. With baseline noise the zero crossing is not always clear therefore the 21-point derivative of the Laplacian was calculate which produced clear peaks, which allowed for activation detection with a thresholding approach to detect activation times. Each recording was 500 ms in duration.

