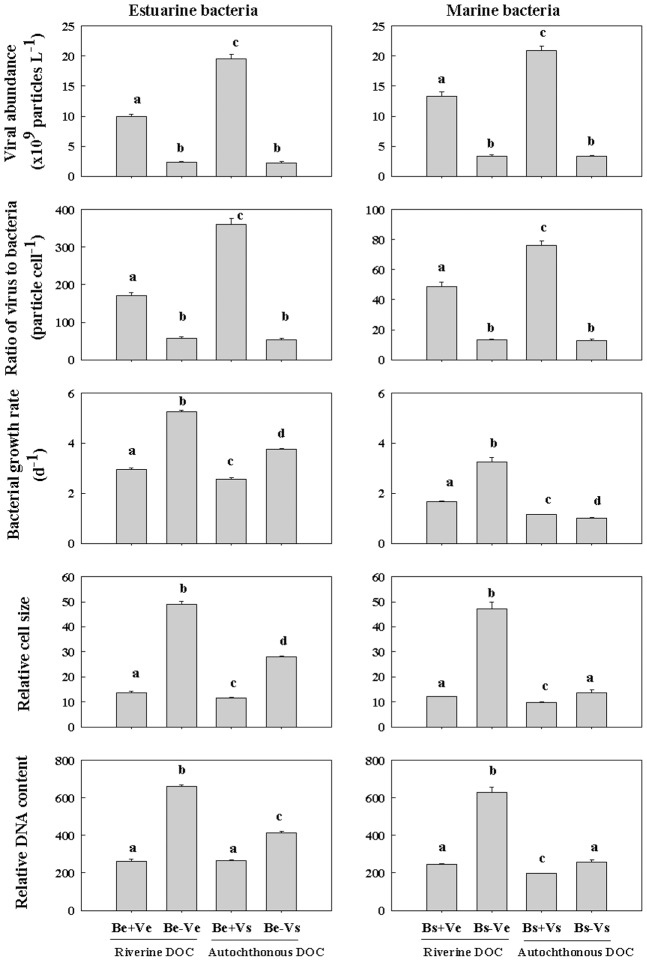
Figure 3. Viral abundance (VA) and virus to bacteria abundance ratio at the beginning of the incubation.
Bacterial growth rate, relative cell size, and relative DNA content at the end of the incubation among eight treatments: 1) estuarine bacteria + virus-rich estuarine water (Be+Ve); 2) estuarine bacteria + virus-free estuarine water (Be-Ve); 3) estuarine bacteria + virus-rich seawater (Be+Vs); 4) estuarine bacteria + virus-free seawater (Be-Vs); 5) seawater bacteria + virus-rich estuarine water (Bs+Ve); 6) seawater bacteria + virus-free estuarine water (Bs-Ve); 7) seawater bacteria + virus-rich seawater (Bs+Vs); 8) seawater bacteria + virus-free seawater (Bs-Vs). Vertical bars indicate ± 1SE and n = 3. Different letters (a, b, c, d) denote that the treatment was significantly different (p<0.05) and the same letters denote that the treatment was not significantly different (p>0.05).

