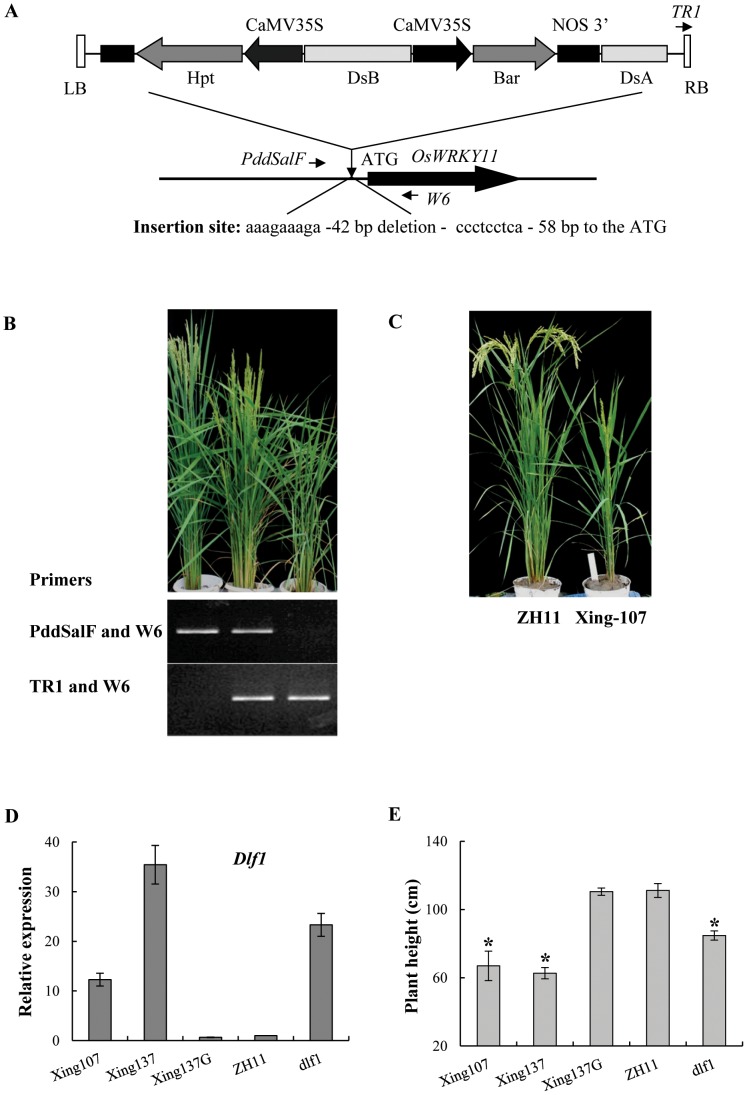
Figure 2. Molecular features of Dlf1.
(A) Structure of T-DNA insertion site. The perpendicular arrow head indicates the insertion site. The T-DNA was inserted into the upstream of OsWRKY11. Arrows indicate the primers used for analyzing the insertion site. LB and RB represent the left and right borders of T-DNA. (B) PCR genotyping Dlf1 segregants in F2 with primers as indicated in A (showed in italics). Primers PddSalF and W6 amplify a product from wild-type. PCR-positive plants with primers of TR1 and W6 indicate T-DNA insertion in the examined site and a homozygote for the insertion if without an amplification product from PddSalF and W6. (C) Photos of ZH11 (left) and Cp-Ins-Dlf1 transgenic T1 plant (named as Xing-, right), taken when ZH11 reached maturity. (D) Expression of Dlf1 in transgenic plants of T1 progenies under natural LD conditions. The first and second youngest leaves were sampled from 90-d-old plants for RNA isolation. Transcription levels were quantified by quantitative reverse-transcription PCR (qPCR) and the gene expression was normalized to rice ubiquitin gene (Ubq) for each sample. Transcription levels are expressed as ratio to the level of transcript in ZH11. (E) Plant heights. Xing-, the transgenic plants, the suffix G for segregated non-transgenic plants; ZH11, the control and dlf1, the mutant. The plants were grown in the experimental field under natural LD conditions. Values are shown as means ± SD of two independent experiments. Asterisks indicate significant difference between ZH11 and other lines (P<0.05, Duncan test).

