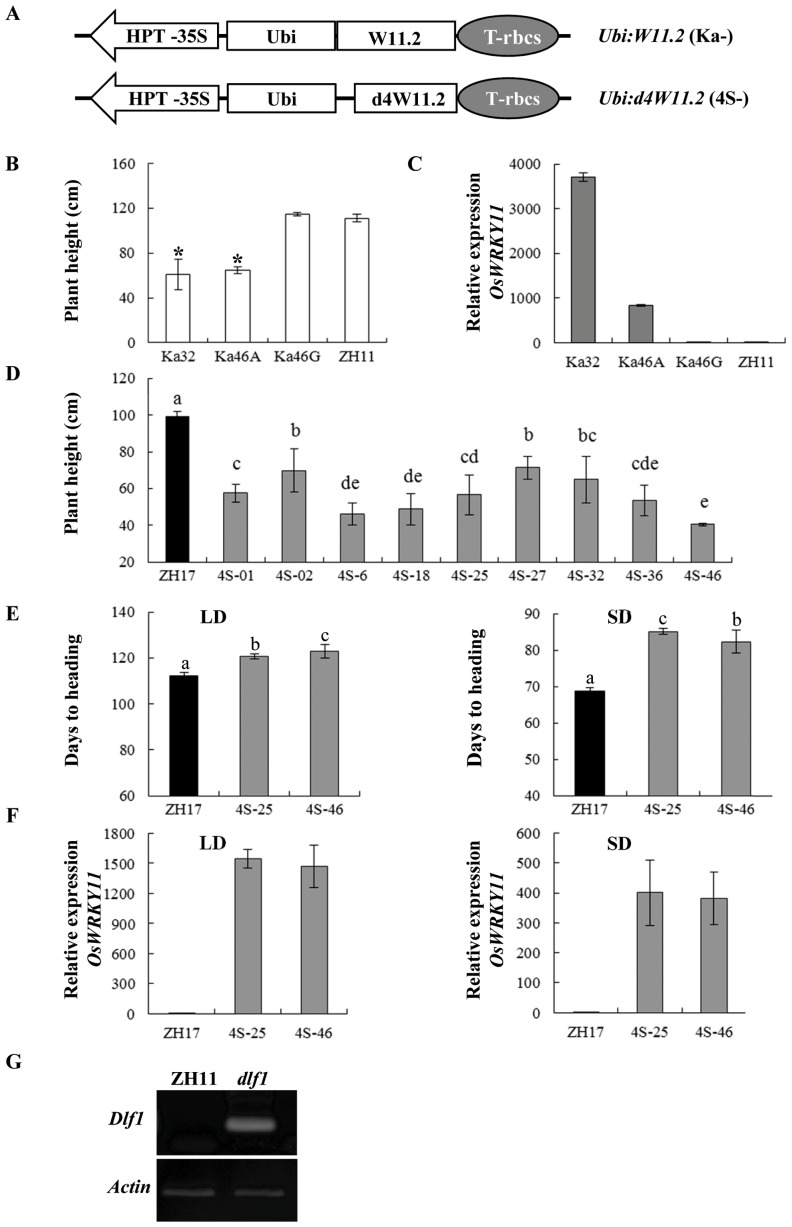
Figure 9. High level expression of the OsWRKY11.2 leads to dwarfism and late flowering.
(A) Schematic diagram of Ubi:W11.2 (Ka-) and Ubi:d4W11.2 (4S-, with 37-aa deletion at the N-terminus of W11.2) constructs. (B) and (D) Plant heights of those transformed with Ubi:W11.2 or Ubi:d4W11.2 in ZH11 or ZH17 genetic background, respectively. (C) Expression of total OsWRKY11 (including the transferred and endogenous genes) in ZH11 and the Ubi:W11.2 transgenic lines of T1 progenies under natural LD conditions. The first and second youngest leaves were sampled from 90-d-old plants for RNA isolation. Transcription levels were quantified by qPCR and the gene expression was normalized to rice ubiquitin gene (Ubq) for each sample. Transcription levels are expressed as ratio to the level of transcript in ZH11. The suffix A for dwarf and G for segregated non-transgenic plants. (E) Days to heading of the Ubi:d4W11.2 plants of T2 progenies under SD and LD conditions (the same treatments as in Fig. 6). (F) Expression of total OsWRKY11 in ZH17 and the Ubi:d4W11.2 transgenic plants of T2 progenies under both LD and SD conditions (the same treatments as in Fig. 6). Transcription levels are expressed as ratio to the level of transcript in ZH17. (G) Analysis of the possible degraded mRNA of Dlf1 using the RNA ligase-mediated amplification of 5′ cDNA ends (RLM-RACE). Total RNAs were isolated from the dlf1 mutant (dlf1) and the wild-type (ZH11) of three-week-old plants. Two rounds of PCR were performed: 1) by using an outer primer from the adaptor and a Dlf1-specific reverse primer W5; and 2) by using the inner primer from the adaptor and a Dlf1 gene primer W4 for 30 cycles. Actin gene was used as an internal standard. Asterisks indicate significant difference between ZH11 and the overexpression lines (P<0.05, Duncan test). a, b, c, d, and e indicate ranking by Duncan test at P<0.05, starting from a. Different letters indicate significantly difference from each other.

