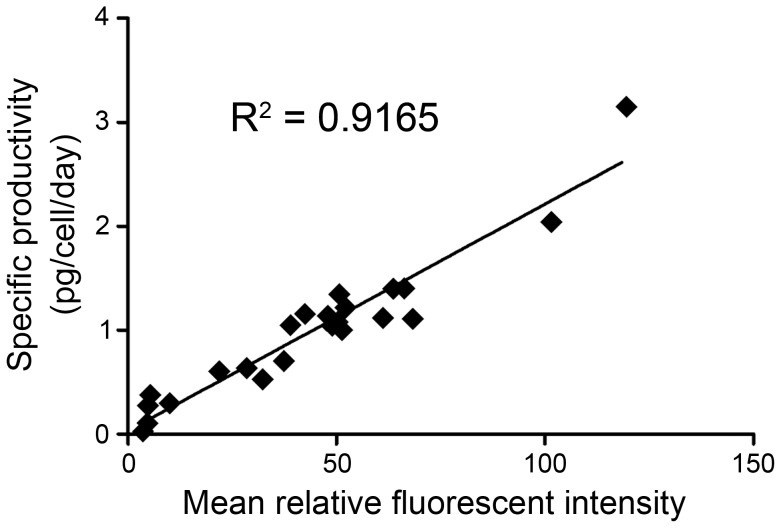
Figure 4. Calculation of the correlation coefficient between the secreted αEGFR Ab and the membrane-anchored αEGFR Ab-RAKR-B7.
Each dot represents a monoclonal cell isolated from HEK-293/αEGFR cells. The cultured medium was collected from each clone and the secretion level of αEGFR Ab was determined by ELISA; the monoclonal cells were treated with furin inhibitor (20 µM) and analyzed by flow cytometry. The Y-axis represents the titer of secreted αEGFR Ab in the absence of furin inhibitor. The X-axis represents the mean relative fluorescent intensity of membrane-anchored αEGFR Ab-RAKR-B7 stained with FITC conjugated anti-human IgGFcγ antibody. Collectively, the titer of secreted αEGFR Ab and the surface expression level of anchored αEGFR Ab-RAKR-B7 reveal a highly positive correlation (R2 = 0.9165).

