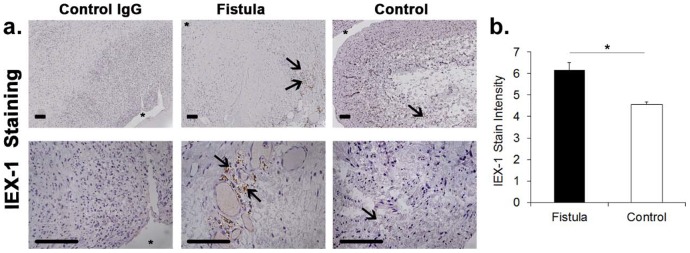
Figure 1. IEX-1 expression in malfunctioning AV fistulae when compared to controls removed from patients.

Representative IEX-1 staining (a) is shown in a on outflow veins removed from patients with malfunctioning AVF when compared to control veins removed from patients undergoing placement of a AVF. IEX-1 expression was localized to the adventitia (arrow heads) of AVF when compared to controls. Brown staining cells are positive for IEX-1. Top row is 10X and bottom row is 40X. Scale bar is 100-µms. * denotes vessel lumen. Pooled data from the semiquantitative analysis for intensity of IEX-1 staining in the vessel wall of the outflow vein specimens removed from patients with AVF or controls is shown in b. This demonstrates a significant increase in the mean IEX-1 expression in the AVF when compared to controls (P<0.05). Each bar shows the mean ± SEM of 3 samples per group. Two-way Student t-test was performed. Significant difference from control value is indicated by * P<0.05.
